View the Live Project
Explore the live Options Trader web platform built for advanced F&O traders
What's Options Trader by Dhan?
Options Trader by Dhan is a dedicated web platform for advanced F&O traders a faster, more data-dense workspace than the standard Dhan app. Dhan had no dedicated F&O web platform before this. This was built from scratch.
- Tools: Option chain, strategy builder, straddle tool, real-time market data
- Goal: A standalone landing page to own organic search and convert serious traders into sign-ups
Team
|
1 - Product Designer (Myself) |
1 - Growth Lead |
|
2 - Engineers |
Why a separate web property?
Dhan's main platform serves retail investors stocks, SIPs, IPOs. F&O is a different category entirely. Mixing both audiences on one surface fails both:
- Casual investors get overwhelmed by the complexity
- Serious traders don't see the depth they need and leave
So we built a completely separate web property its own domain, tone, and visual language targeting advanced F&O traders arriving through organic search.
What's the problem statement?
Options Trader had strong product capability and very niche users. Organic search was pulling the right audience traders searching for "options trading platform India", "option chain web", "strategy builder F&O". They were arriving. They weren't signing up.
- F&O traders evaluate platforms like developers evaluate tools by using them, not reading about them
- A headline saying "Advanced Option Chain" means nothing to someone trading 50 lots a day
- The interface has to prove itself before asking for a sign-up
What we're solving for?
- For the trader: See the real product before signing up no marketing fluff, no forced login to peek inside
- For the business: Own organic search for advanced F&O queries bring qualified traders in without paid acquisition
The design problem: close the trust gap between a skeptical F&O trader and a sign-up form.
Who are we solving for?
The Super Trader - a high-frequency F&O trader actively comparing platforms side-by-side.
- Knows what a real option chain looks like
- Can tell in seconds if a platform is serious or a marketing wrapper
- Doesn't convert on copy, converts on product proof
- Not browsing for inspiration, evaluating tools
What was everyone else doing?
We audited every major F&O platform a trader might compare us against: Sensibull, Opstra, NiftyTrader, Groww, and 5paisa. One specific question: what does a trader experience before they sign up?
Three patterns emerged:
- Immediate block - Opstra and NiftyTrader show a login modal the moment you land. The product is invisible before you commit.
- Action-triggered friction - Sensibull lets you browse freely, but every action on Strategy Builder hits a login wall. You can look, you can't touch.
- Partial access with gaps - Groww and 5paisa show some tools (Option Chain, Market Movers), but key F&O tools like Strategy Builder, Straddle Chart, and Straddle Chain are absent.
The full picture across all five competitors:
| Options Trader by Dhan | Sensibull | Opstra | NiftyTrader | Groww | 5paisa | |
|---|---|---|---|---|---|---|
| First load | Page loads freely | Page loads freely | Login modal on load | Login modal on load | Page loads freely | Page loads freely |
| Option Chain | Viewable | Viewable | Blocked | Blocked | Viewable | Viewable |
| Strategy Builder | Fully shown | Viewable - every action triggers login | Blocked | Blocked | Not available | Not available |
| Straddle Chart | Fully shown | Viewable | Blocked | Blocked | Not available | Not available |
| Straddle Chain | Fully shown | Viewable | Blocked | Blocked | Not available | Not available |
| Market Movers | Viewable | Viewable | Blocked | Blocked | Viewable | Viewable |
| Open Interest | Viewable | Not available | Blocked | Blocked | Not available | Not available |
| Market Outlook | Viewable | Not available | Blocked | Blocked | Not available | Not available |
| Popular Strategy | Viewable | Not available | Blocked | Blocked | Not available | Not available |
| Pre-login data | Delayed live market data | Static screenshots | None | None | Static screenshots | Static screenshots |
| UI shown | Real, functional UI - not illustrations or mockups | Real product screenshots | Nothing | Nothing | Partial + illustrations | Text descriptions only |
| Acquisition friction | Low - no modals on every action | Medium - browse freely, hit a wall on every action | High - blocked before seeing anything | High - blocked before seeing anything | Medium - some tools visible, key ones missing | High - education only, no product feel |
| Landing intent | Experience-first | Product-first (freemium) | Registration-first | Registration-first | Brand-first | Education-first |
No competitor was offering the full F&O toolset openly without a login. That was the gap Options Trader by Dhan was built to fill.
What are the non-negotiables?
Each principle is a direct response to a failure pattern found in the competitive audit.
- Show the real product. We designed actual, functional UI components not mockups. What a trader sees before sign-up is exactly what they get after.
- Make the product feel familiar on day one. The landing page and the product must feel identical, so sign-up feels like continuing, not starting over. Any visual gap and trust collapses the moment a trader logs in.
- Scannable at every density. Dense data is fine for this audience unreadable data isn't. Every fold needed to be parseable in under 10 seconds on any screen a trader might be using.
Dark mode lost the hardware test
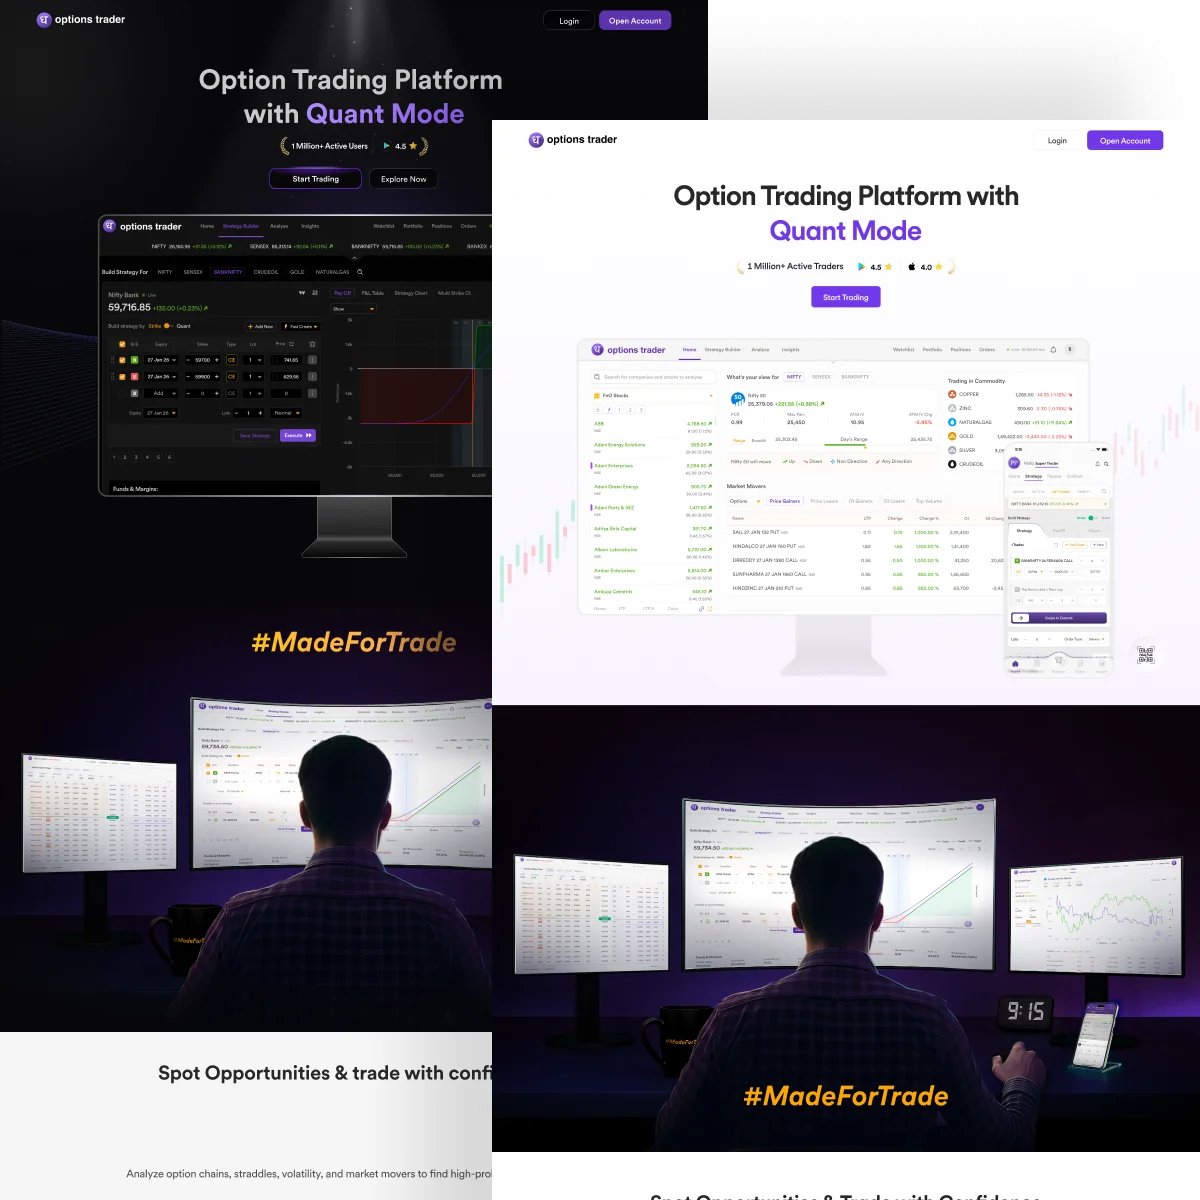
- Started with a dark, cinematic theme - looked great on a studio MacBook
- Tested on mid-range Windows monitors, older office displays, budget laptops - dark backgrounds went muddy, contrast dropped, data tables became hard to scan fast
- Pivoted to light mode before launch - readability beat aesthetics
Design for the hardware your users actually have, not the hardware you design on.
Real UI over illustrations was a trust decision, not a visual one
- We designed real, functional UI components from scratch same layout, data density, and typography a trader would experience post-signup
- When a trader sees the exact interface they'll get, they don't need to take our word for anything they've already seen it work
The fold order is a trust ladder
The section sequence was mapped to how a skeptical trader evaluates a new platform. Each fold answers a specific objection before the trader articulates it:
- Fold 1 - Hero: "What is this, and is it real?" - Identity and immediate product proof in the same breath.
- Fold 2 - Feature Spotlights: "Can it handle my actual workflow?" - Depth, data density, execution speed.
- Fold 3 - Feature Matrix: "Does it have the specific tools I need?" - A fast checklist a trader can run against competitors in seconds.
- Fold 4 - Ecosystem: "Is this company serious?" - Breadth of integrated platforms and the scale of commitment behind it.
The Hook
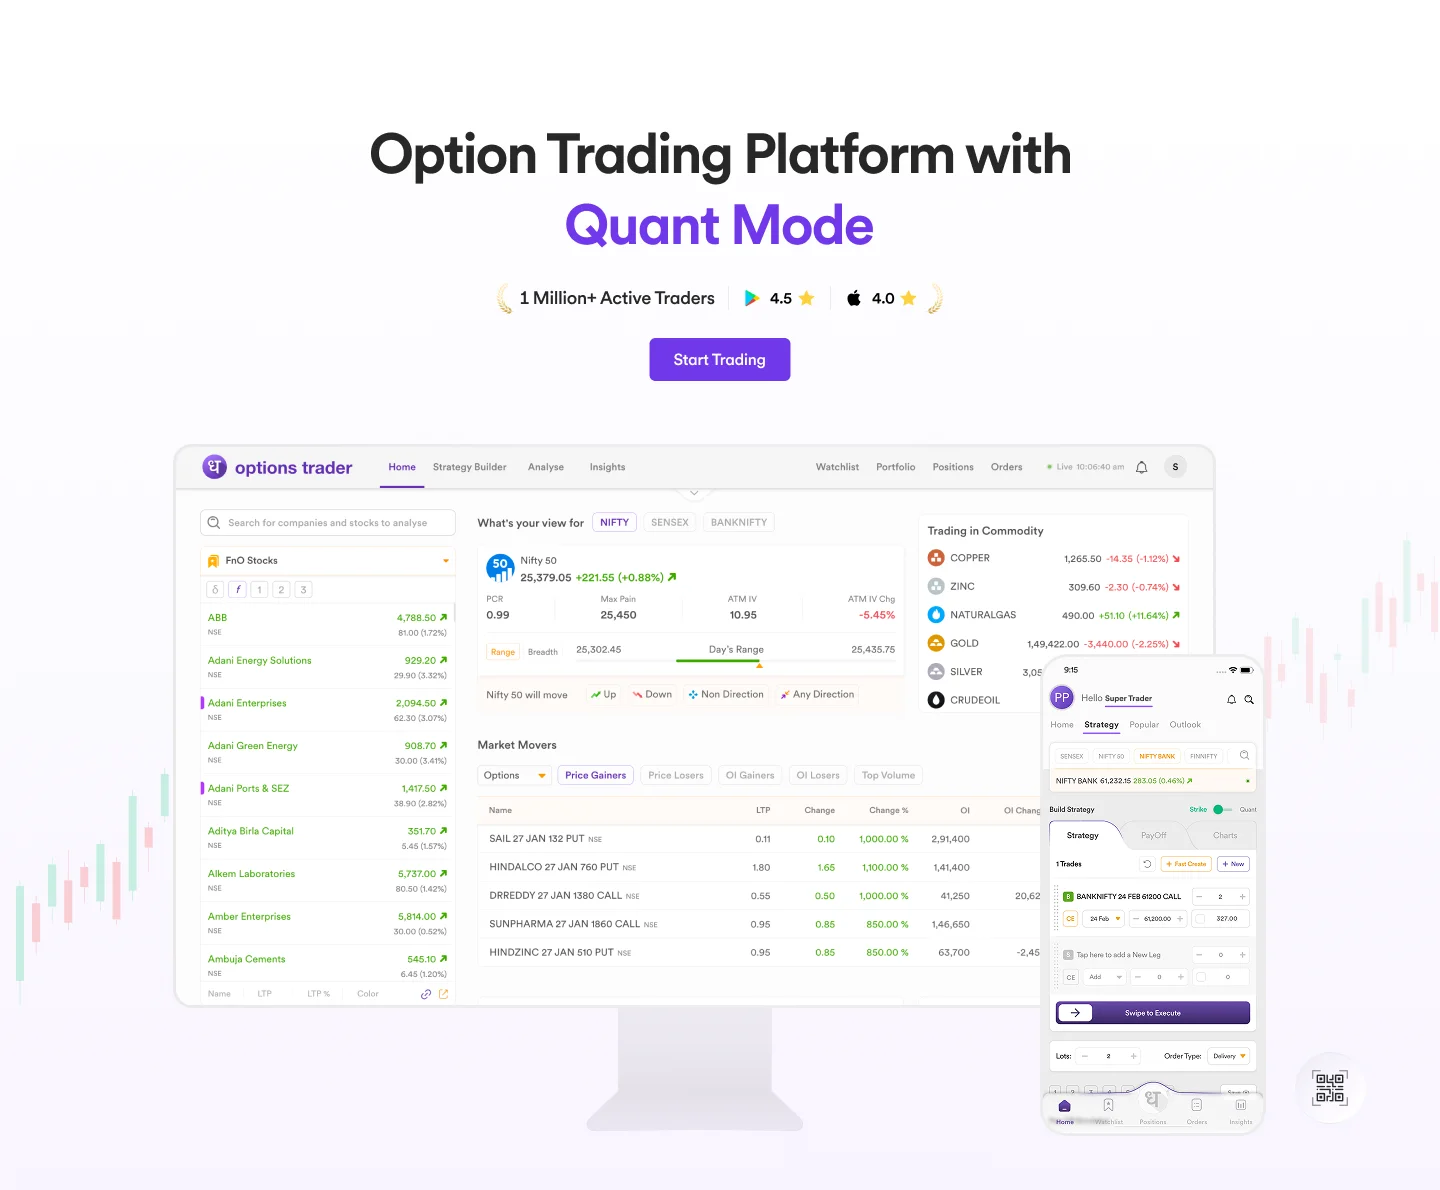
Goal: Answer "what is this and is it real?" in the first five seconds. Show the product, not a promise about it.
Early versions leaned on glowing shadows and dramatic lighting - they looked like movie posters. F&O traders want a tool, not a trailer.
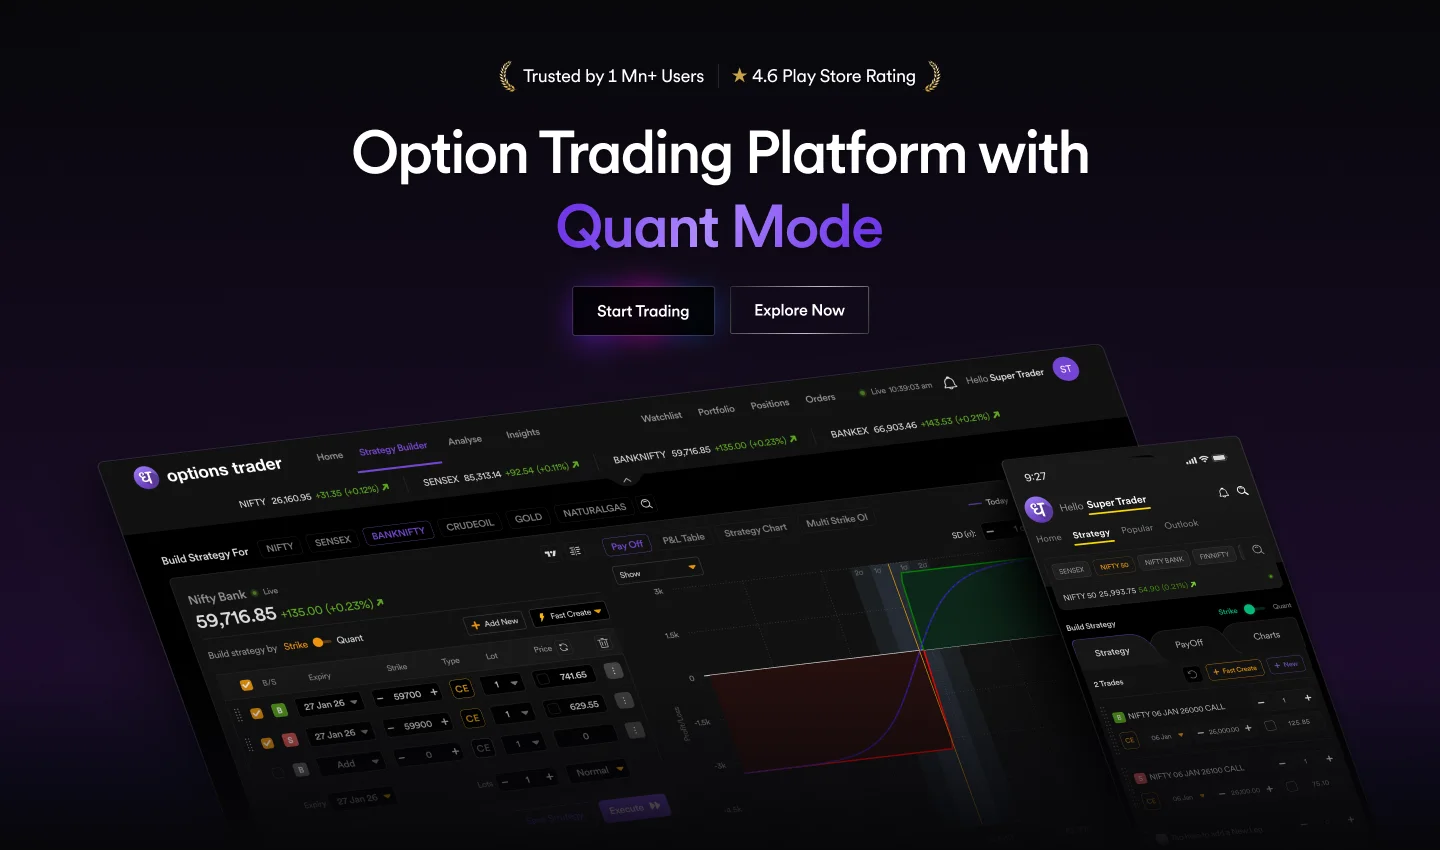
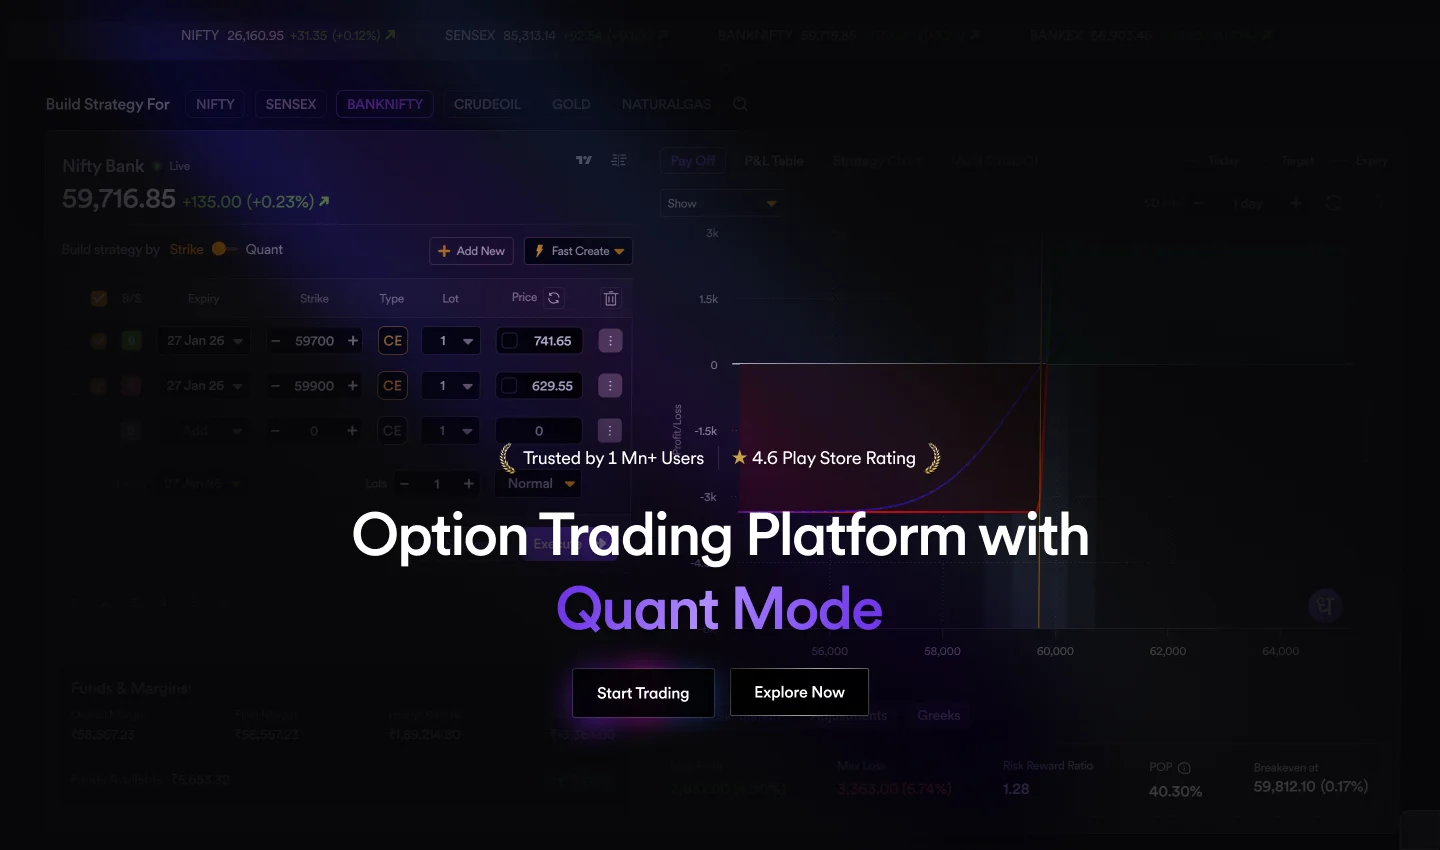
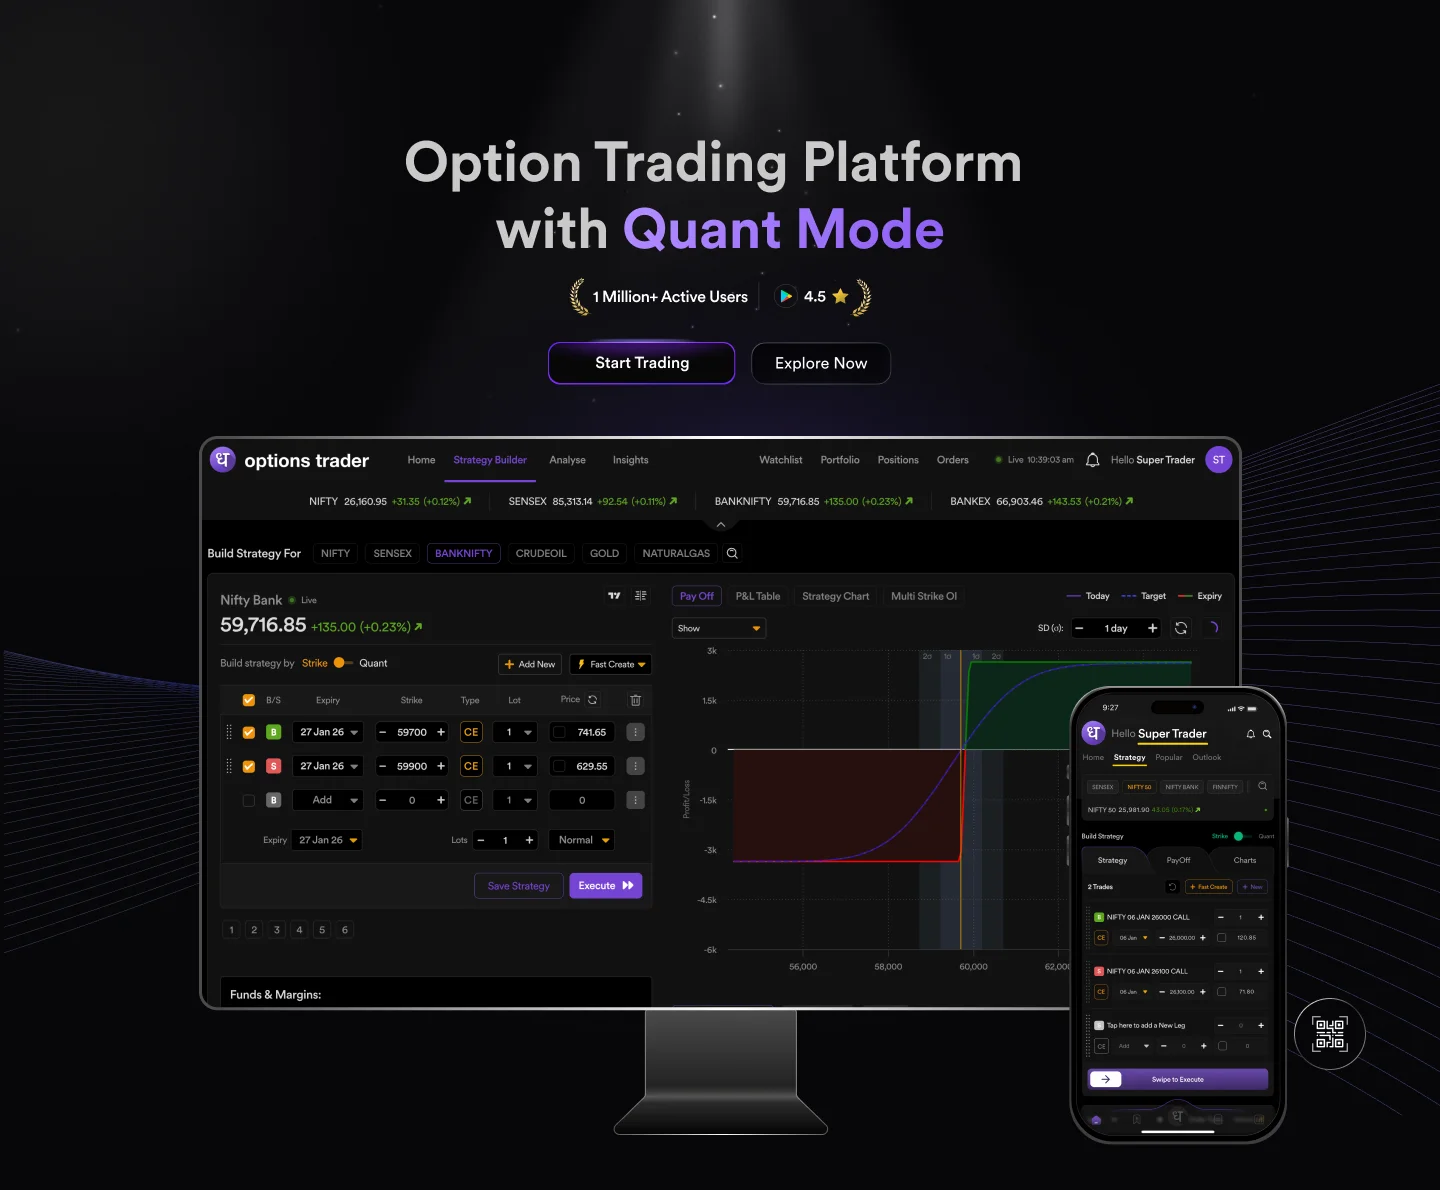
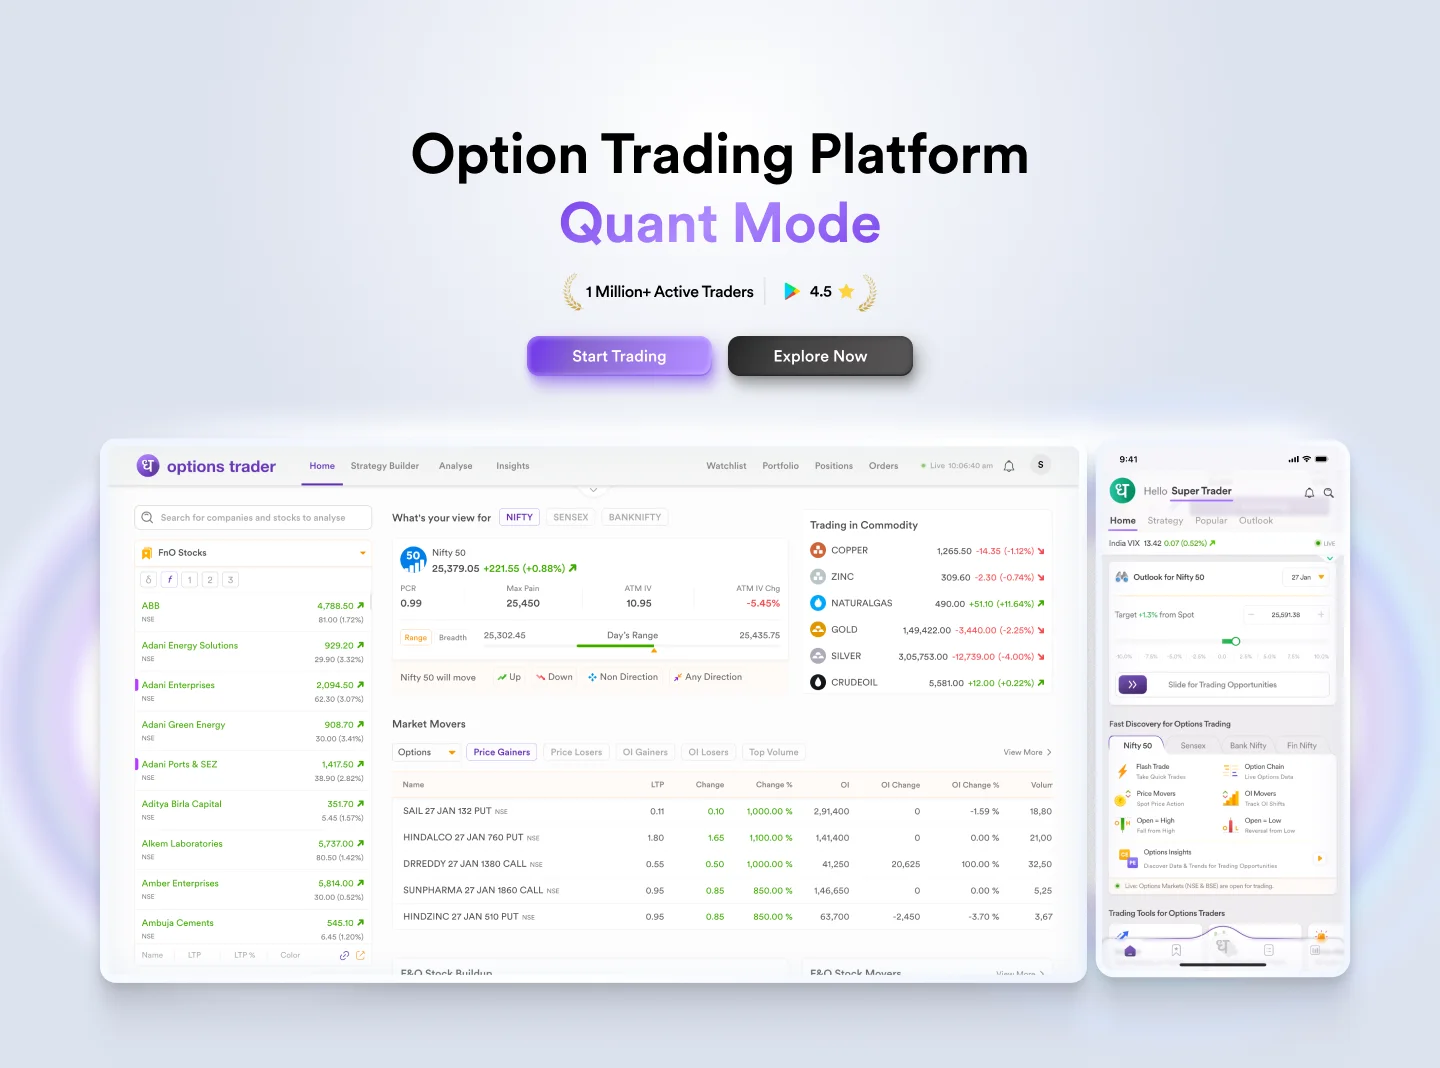
Final: A clean, realistic snapshot of the web platform and mobile app side-by-side. No hype, just proof. The trader sees the actual terminal before reading a single line of copy.
Trade Analysis & Execution Features
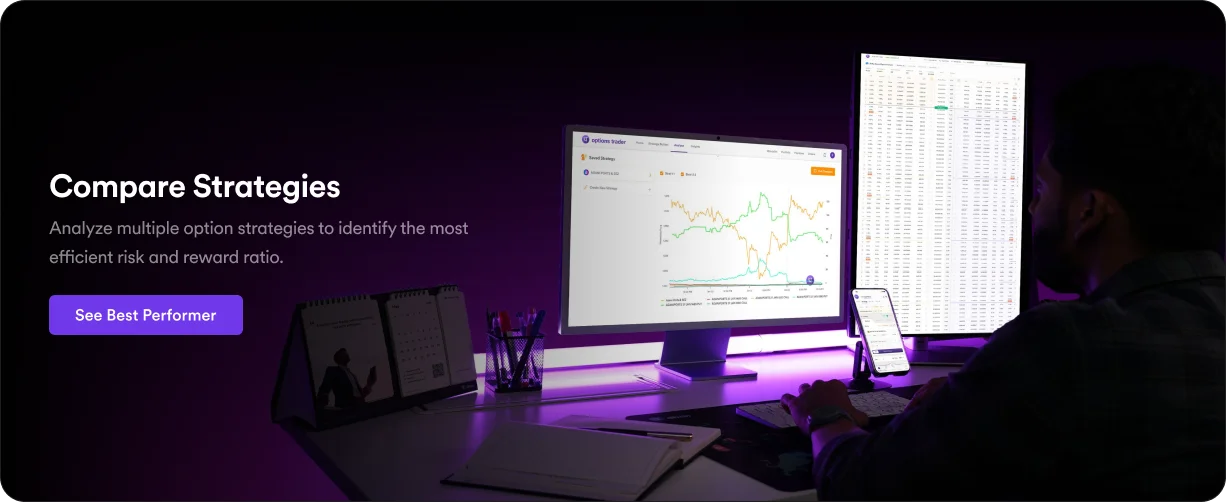
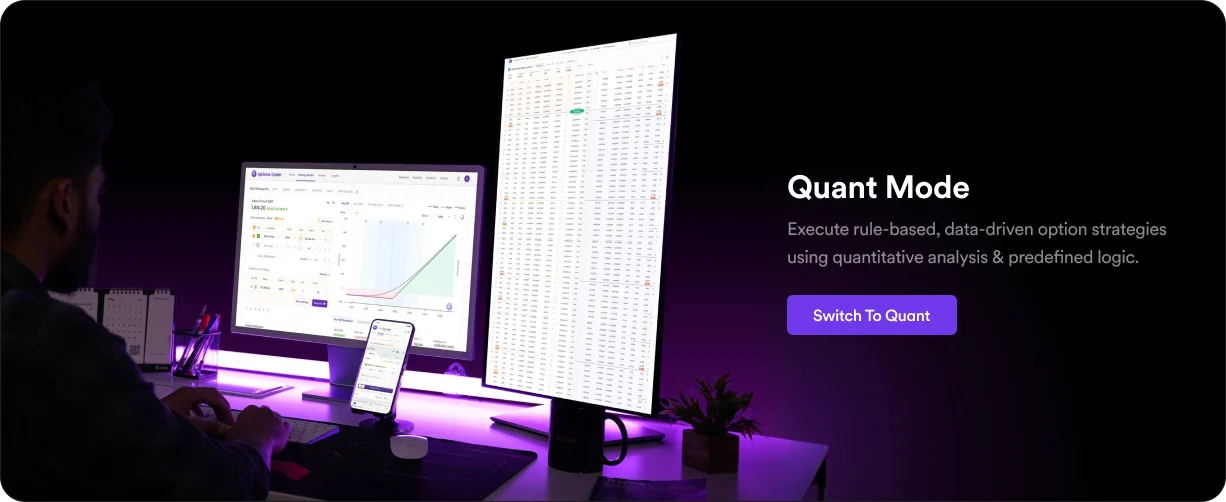
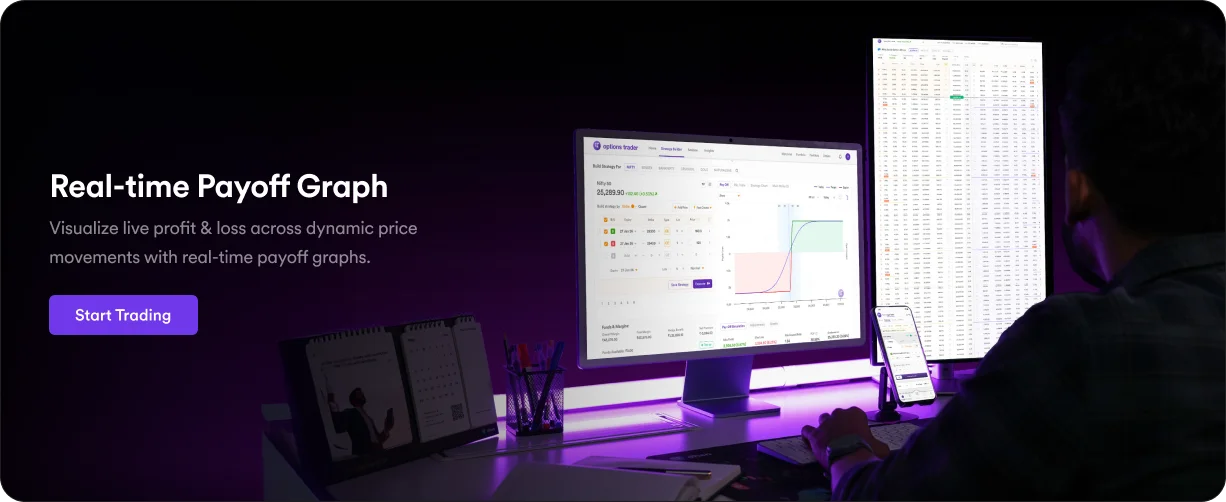
Goal: Prove the platform has the depth and speed advanced traders need. Answer "can it handle my actual workflow?"
Dark cards with glowing borders were scrapped they looked impressive and hurt readability. A trader evaluating a data-dense interface needs numbers to read fast, not glow.
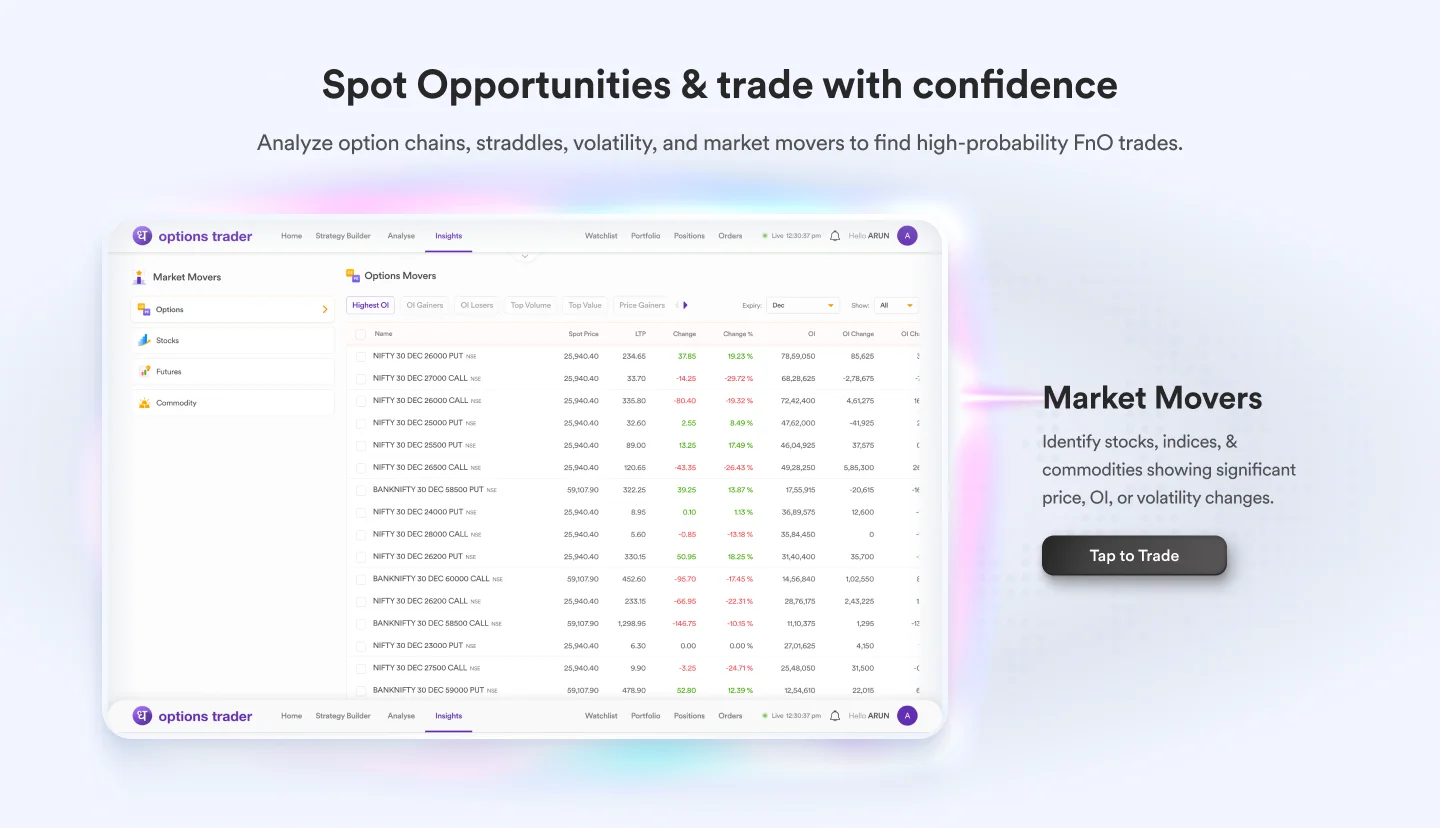
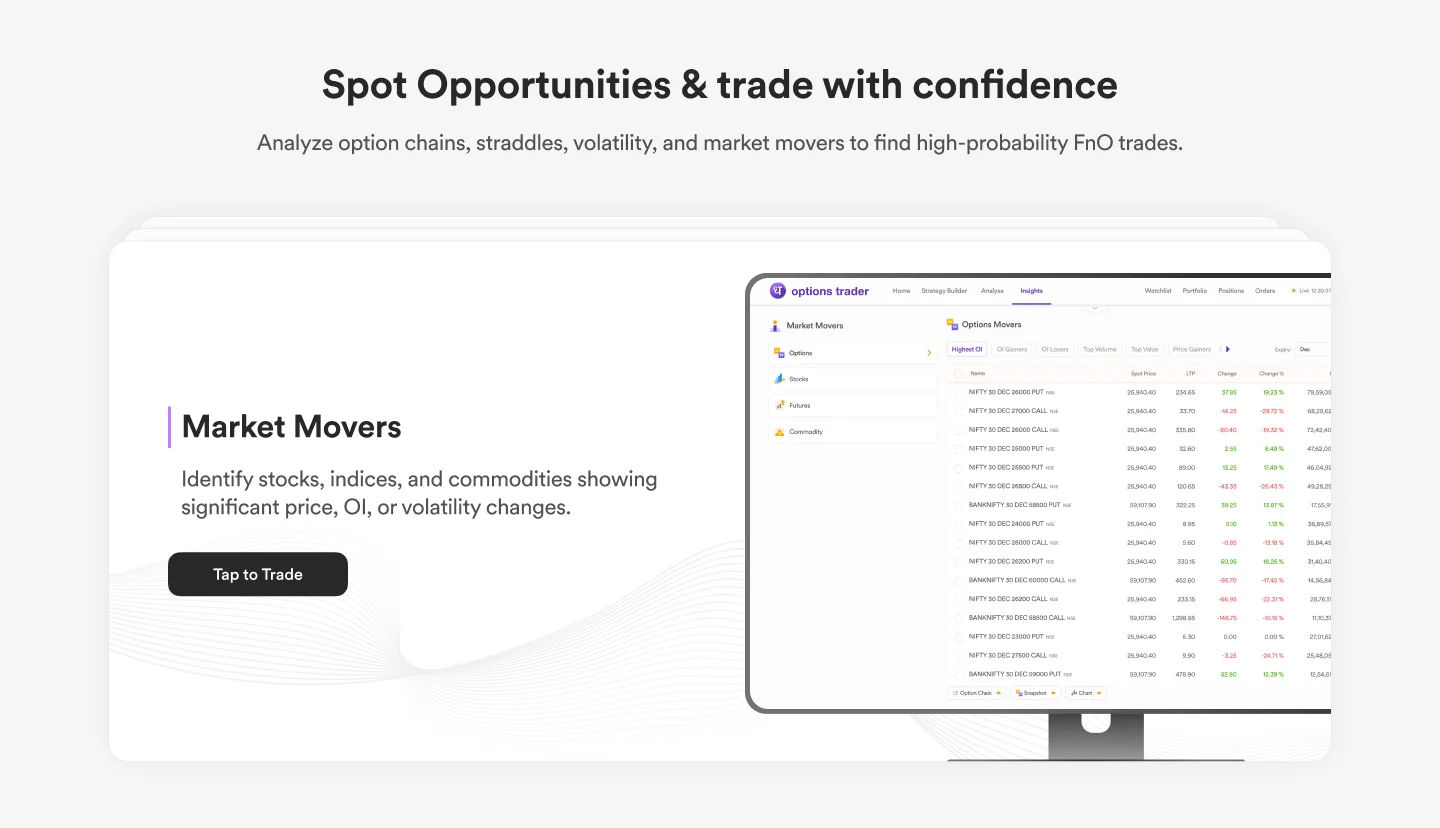
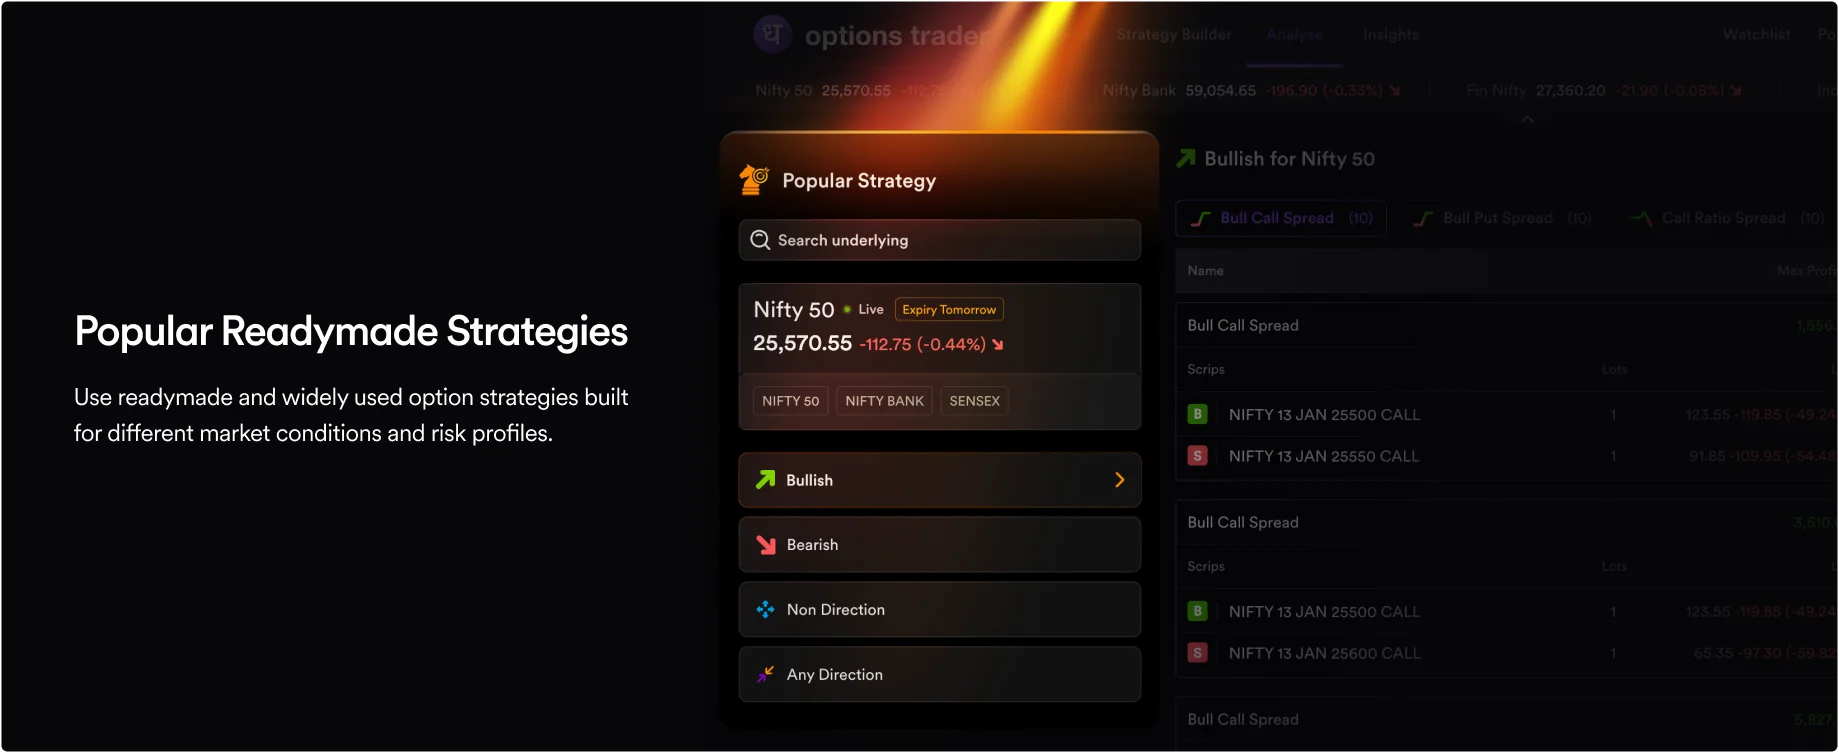
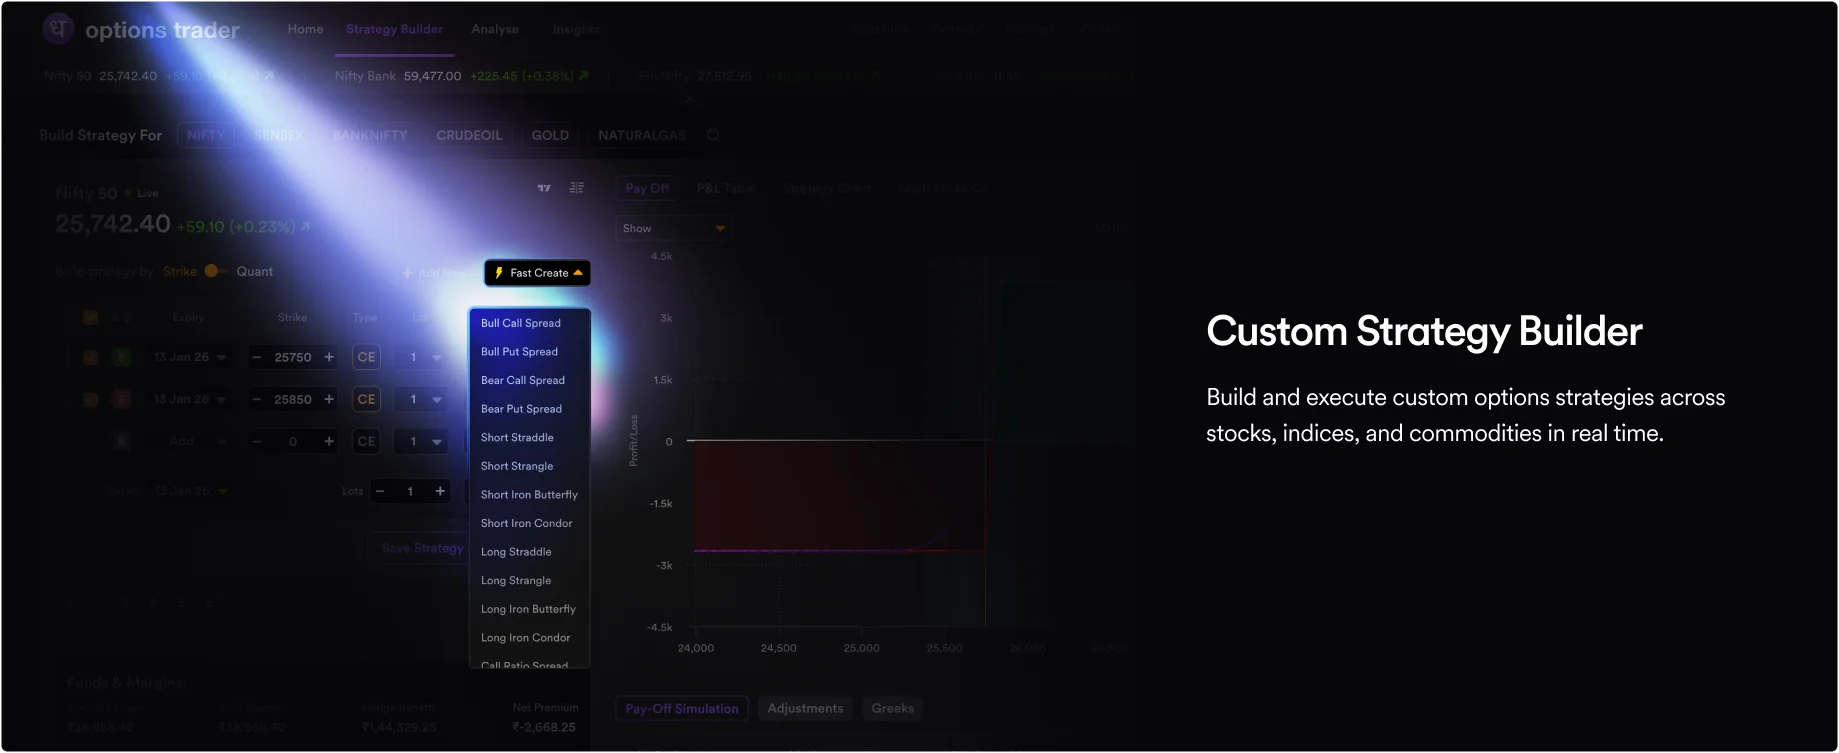
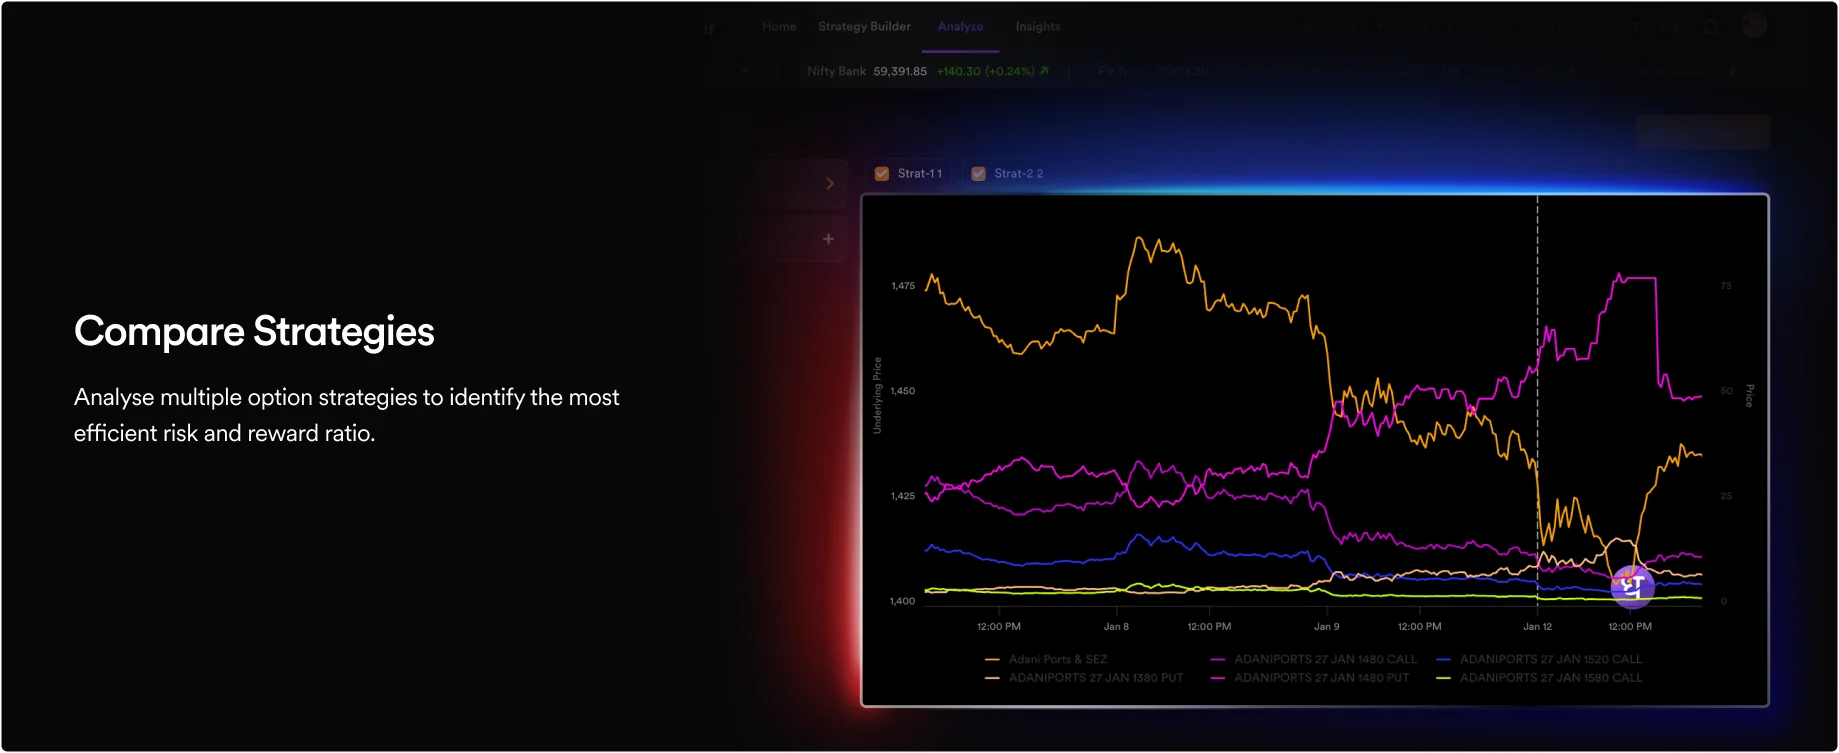
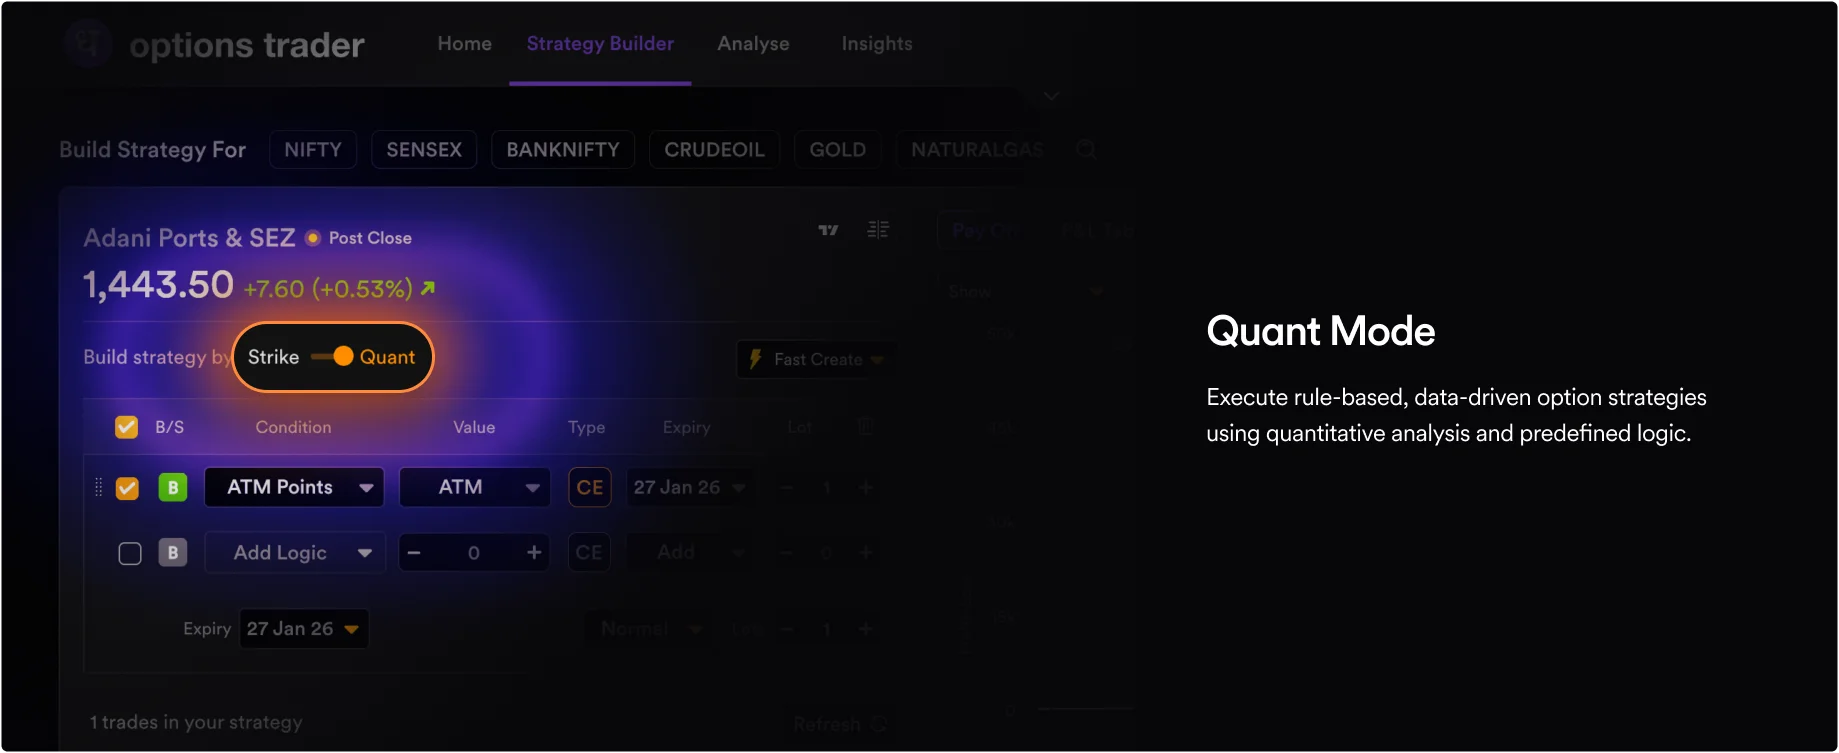
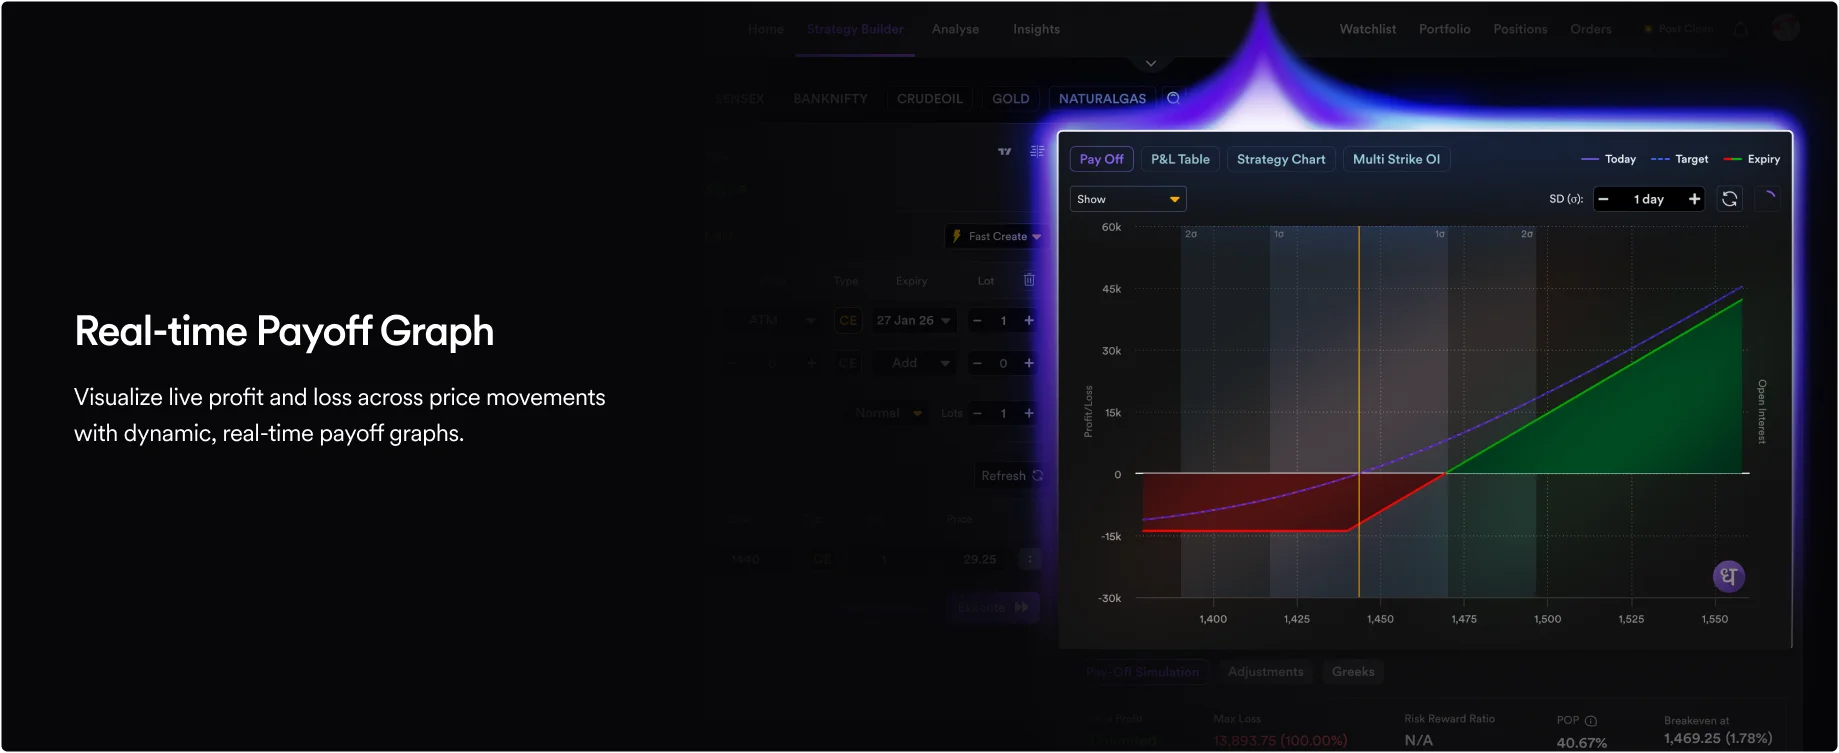
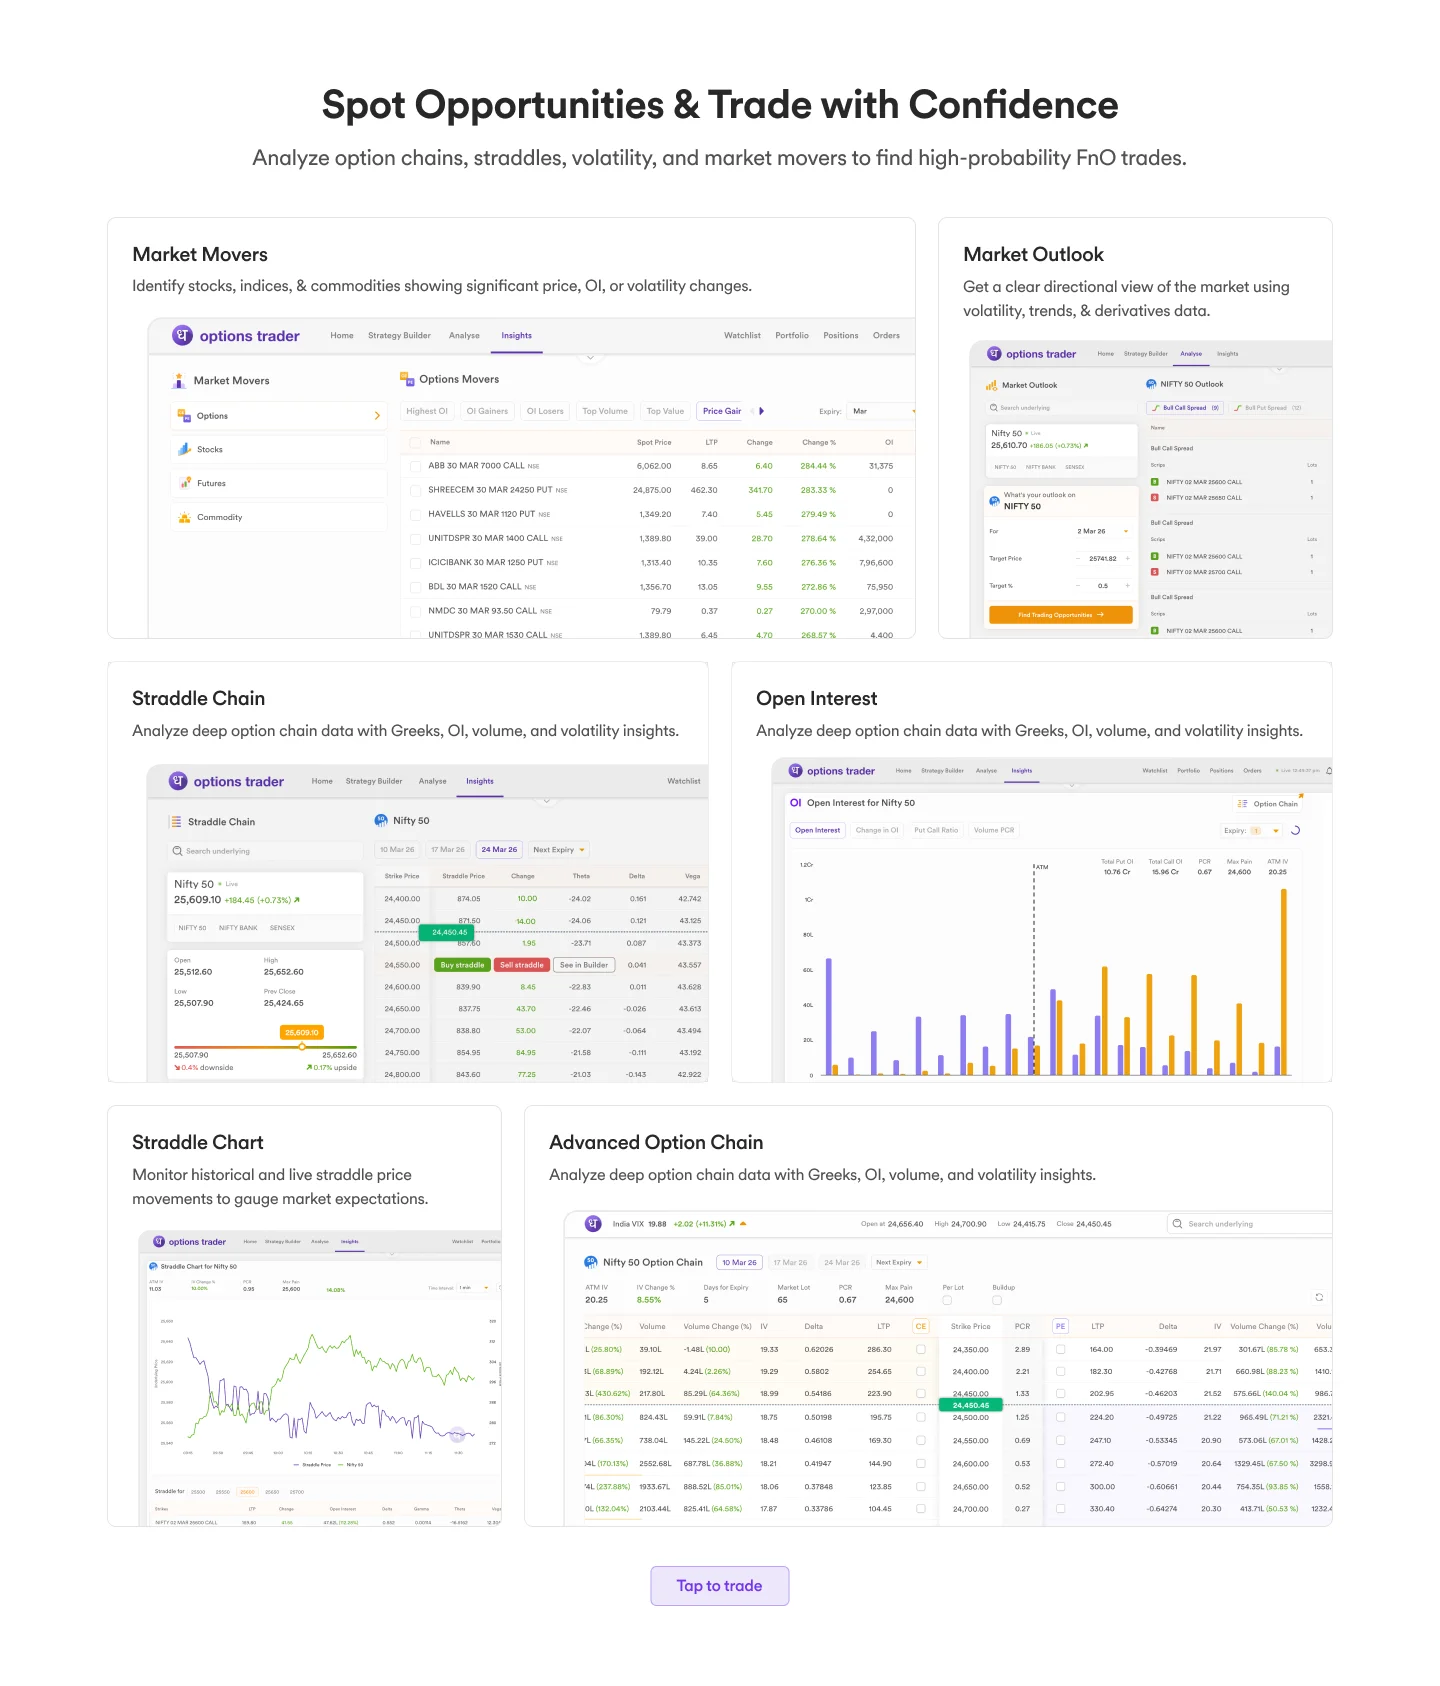
Final: Clean, high-contrast containers with the data on top. Layout mirrors the live app exactly - a trader previewing the page is already seeing the interface they'll use post-signup.
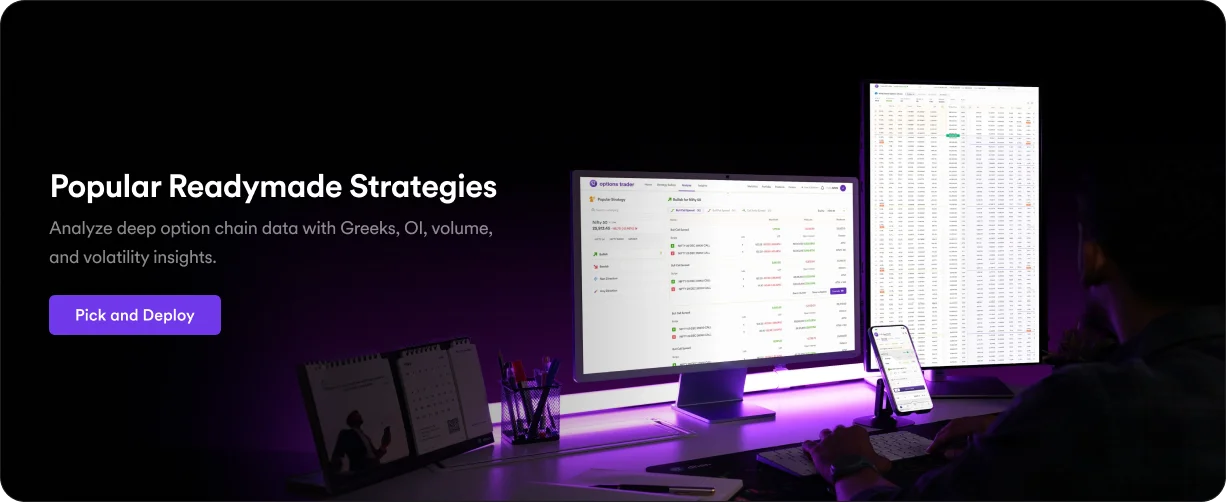
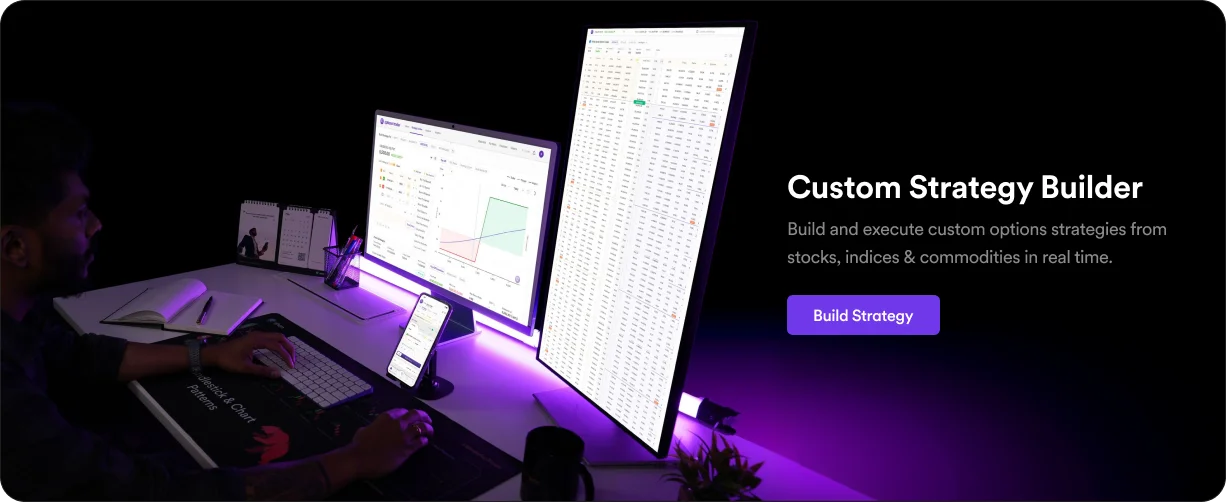
We organised a custom studio photoshoot of real multi-monitor trading setups. I cleaned the photos and mapped our actual interfaces onto the physical screens placing the product in a trader's real environment, not a stock render.
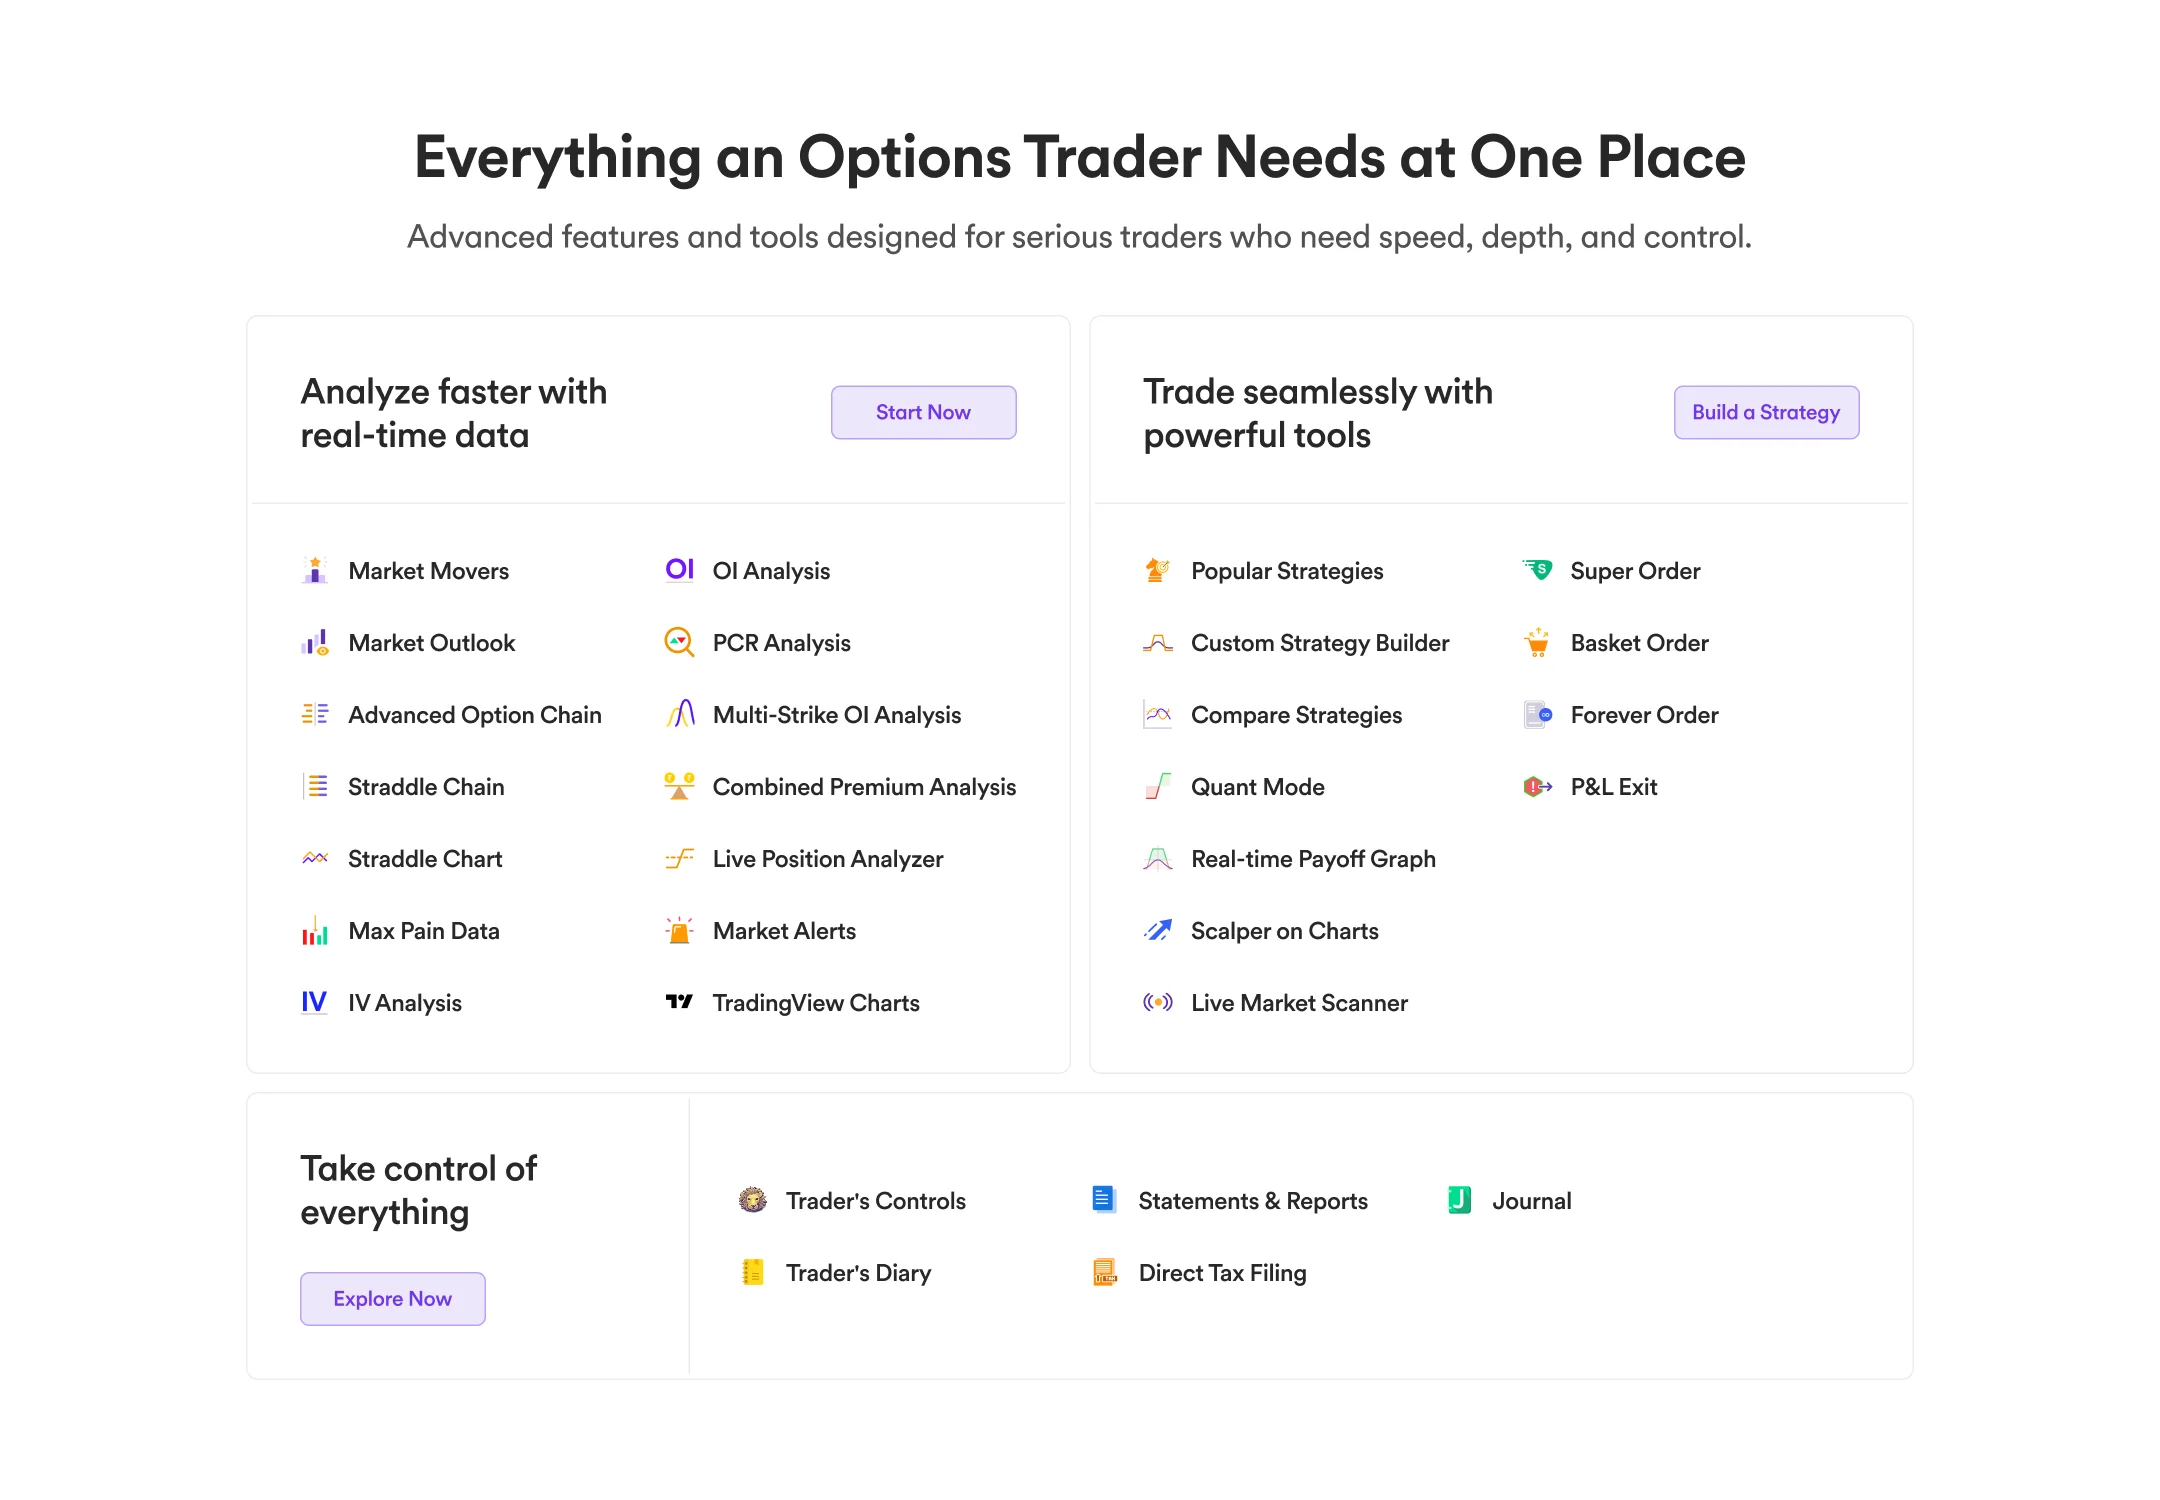
Everything You Need
Goal: Let a trader run through a mental checklist in under 10 seconds confirming we have the specific tools they need.
Dense bullet lists with colored tags were scrapped too cluttered to scan against a competitor at a glance.
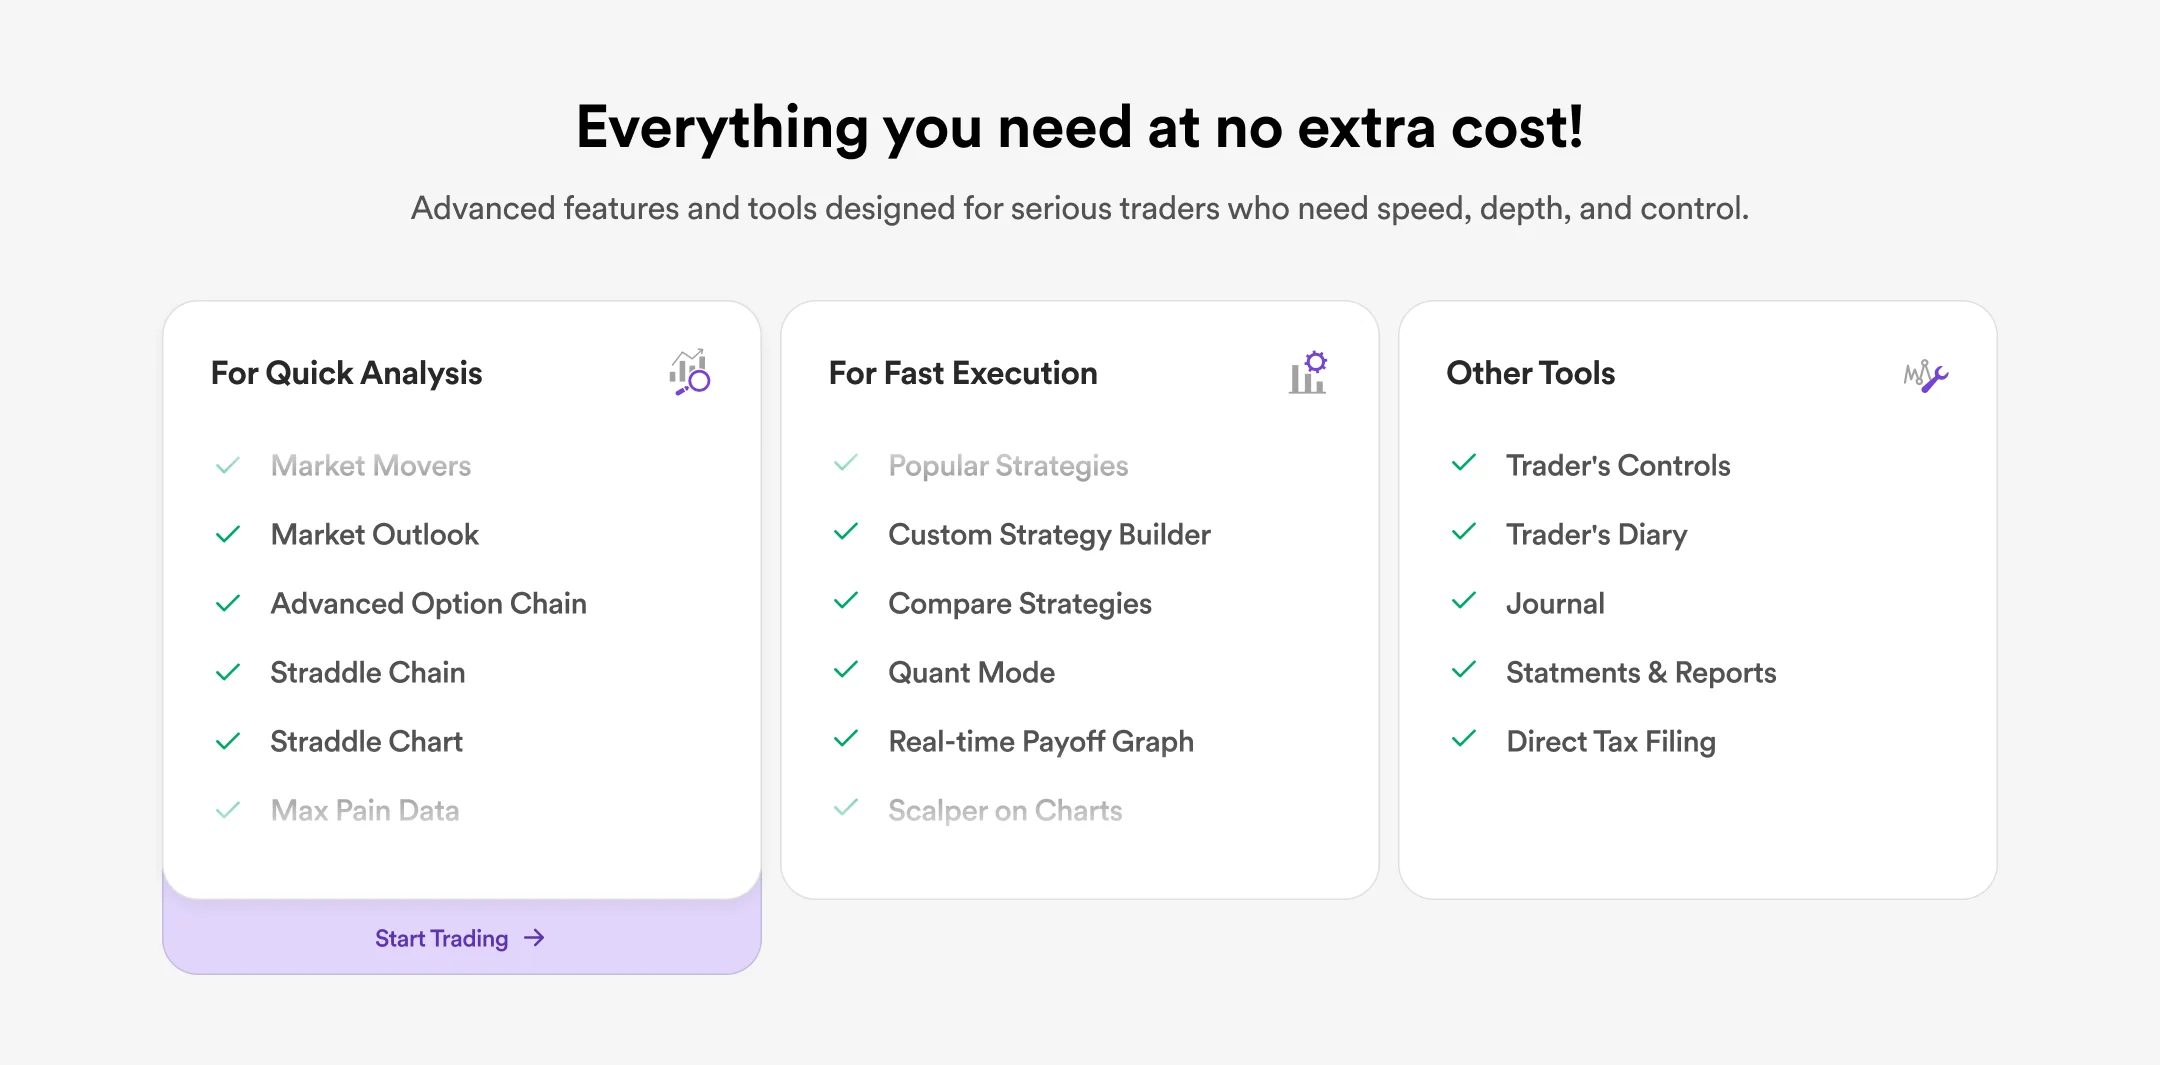
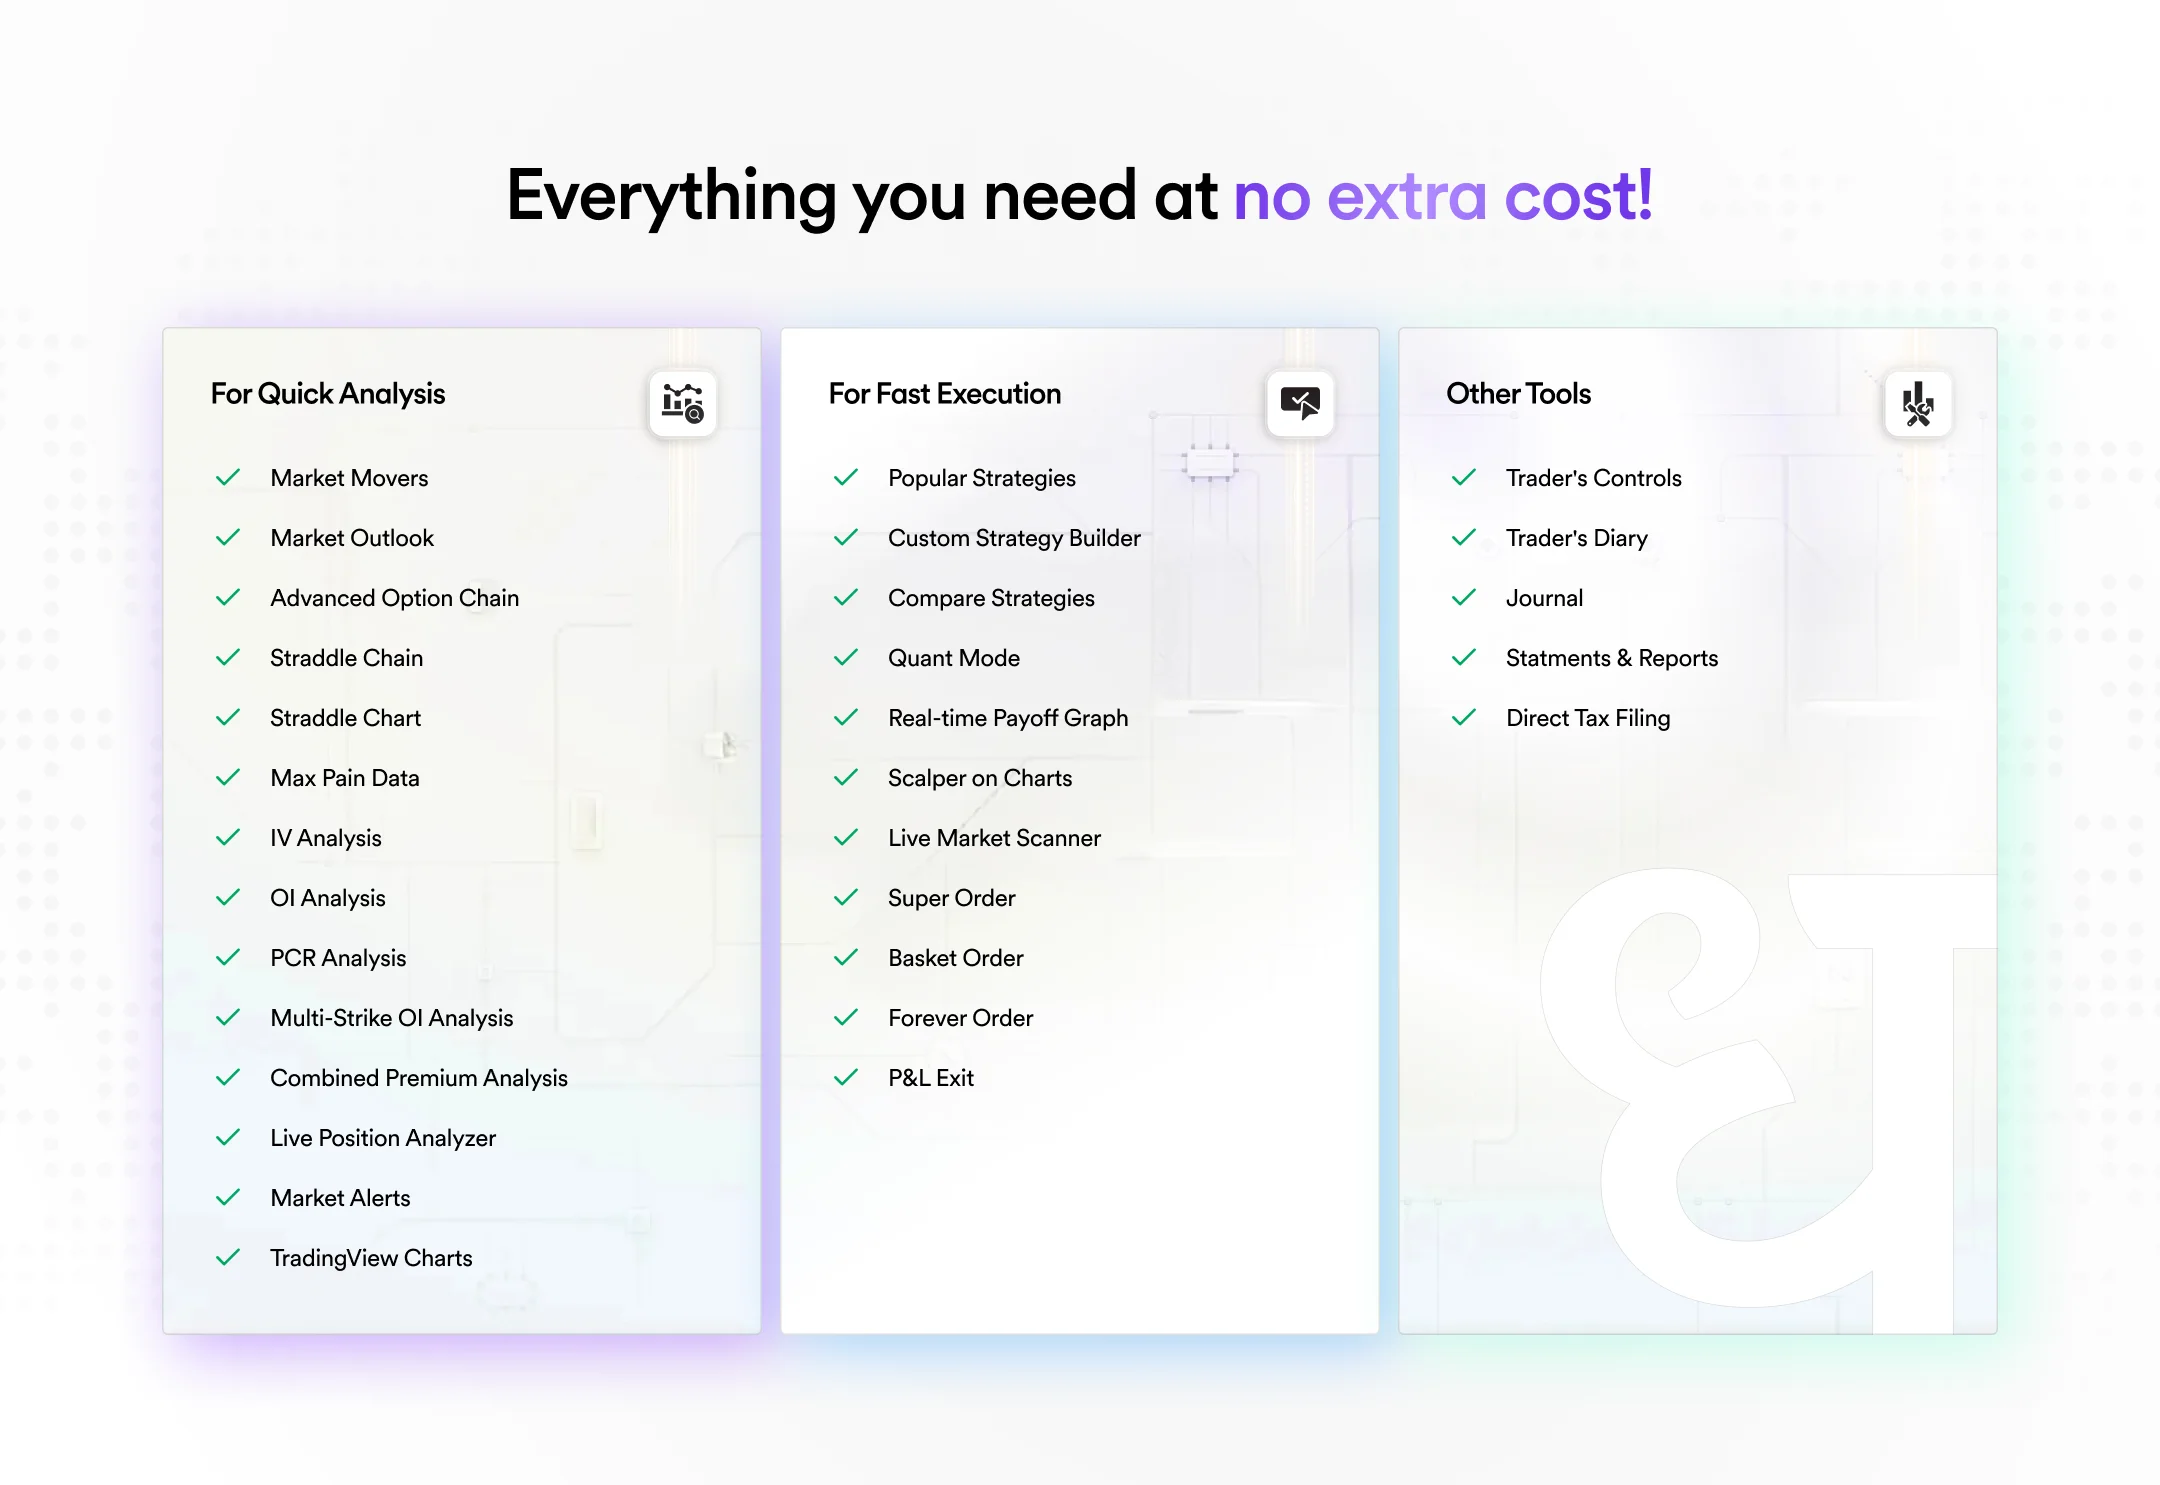
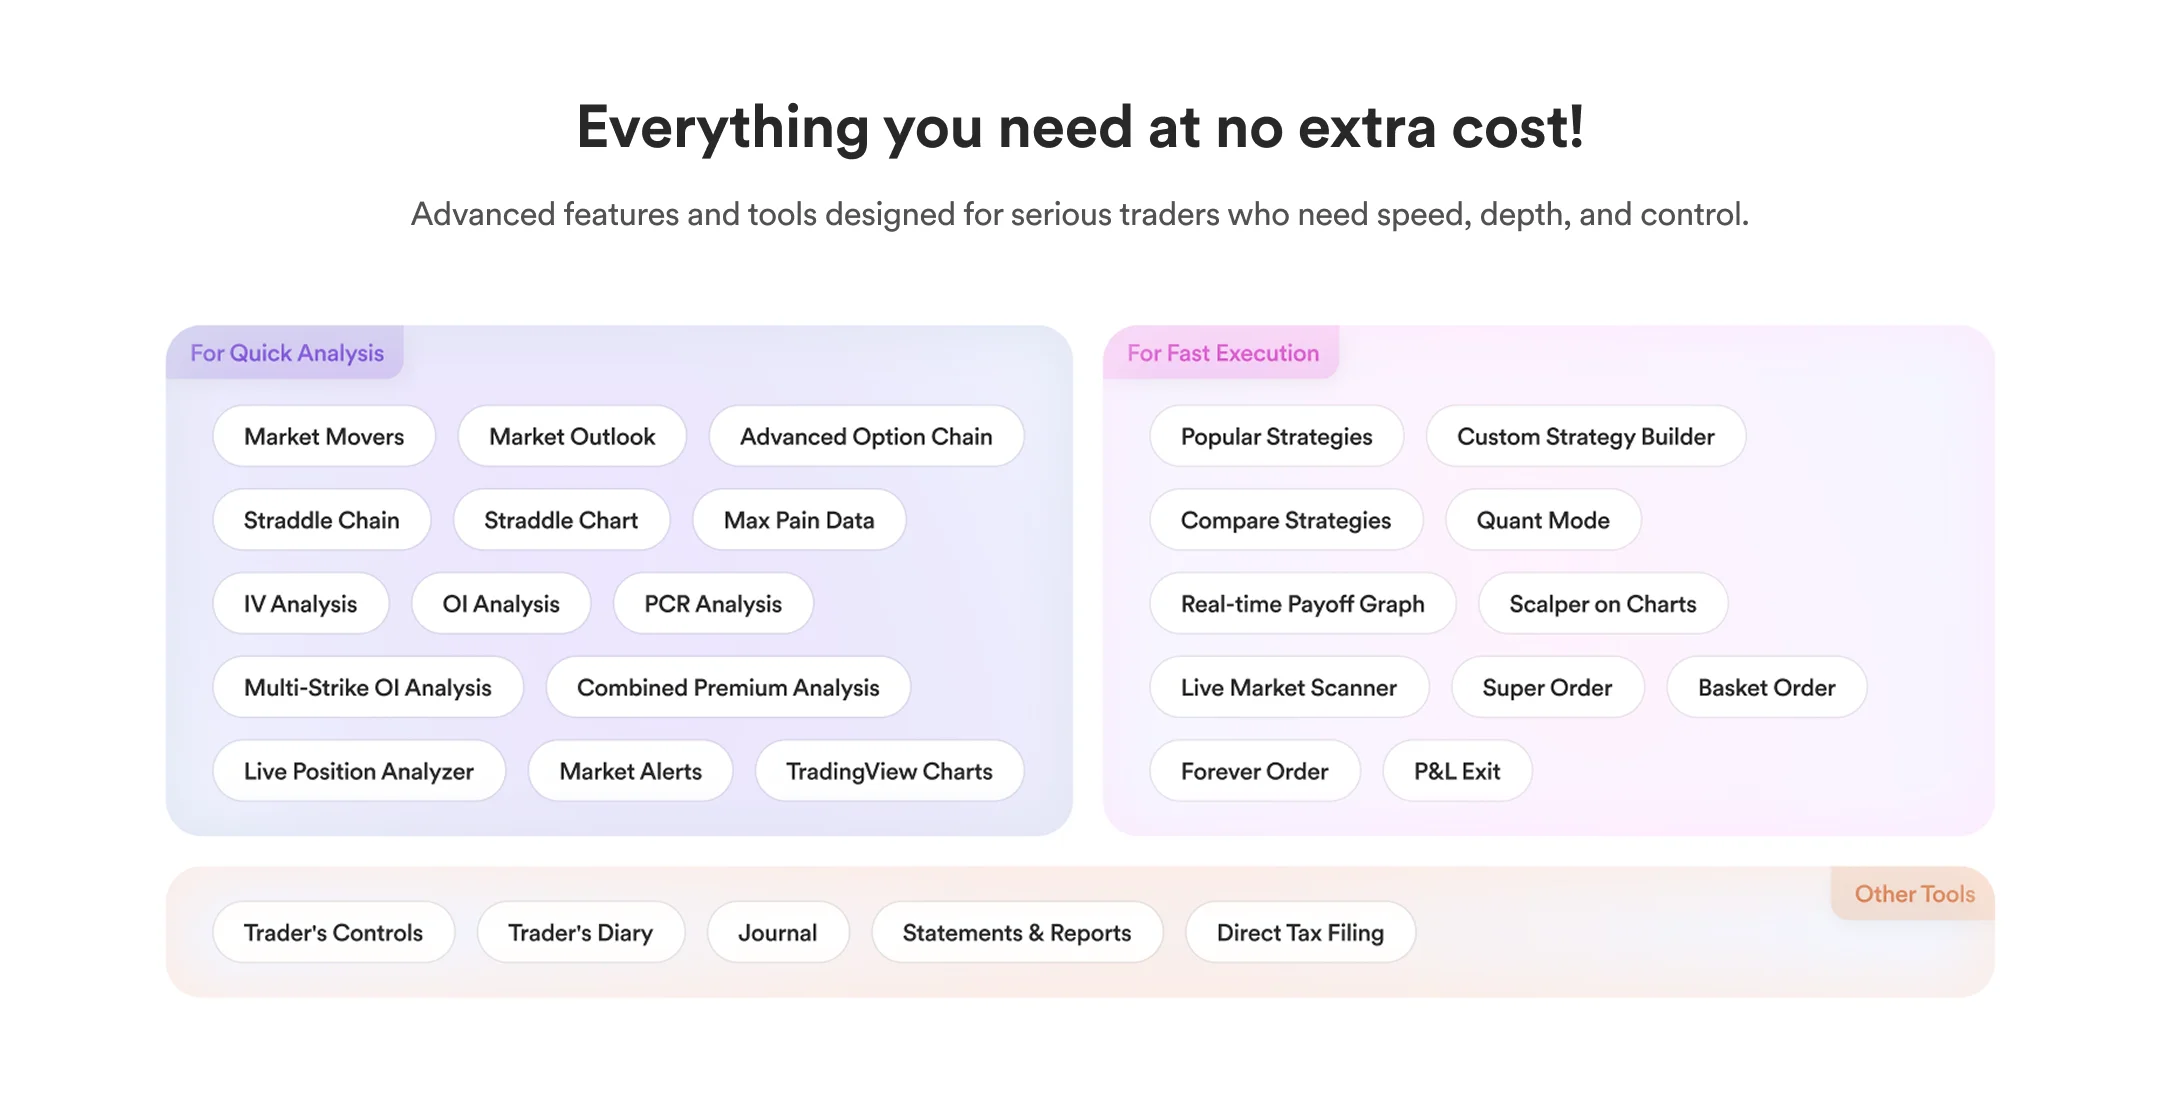
Final: Every tool grouped into three buckets Analysis, Execution, and Other Tools. Clean layout with breathing room so a trader can check us off in seconds.
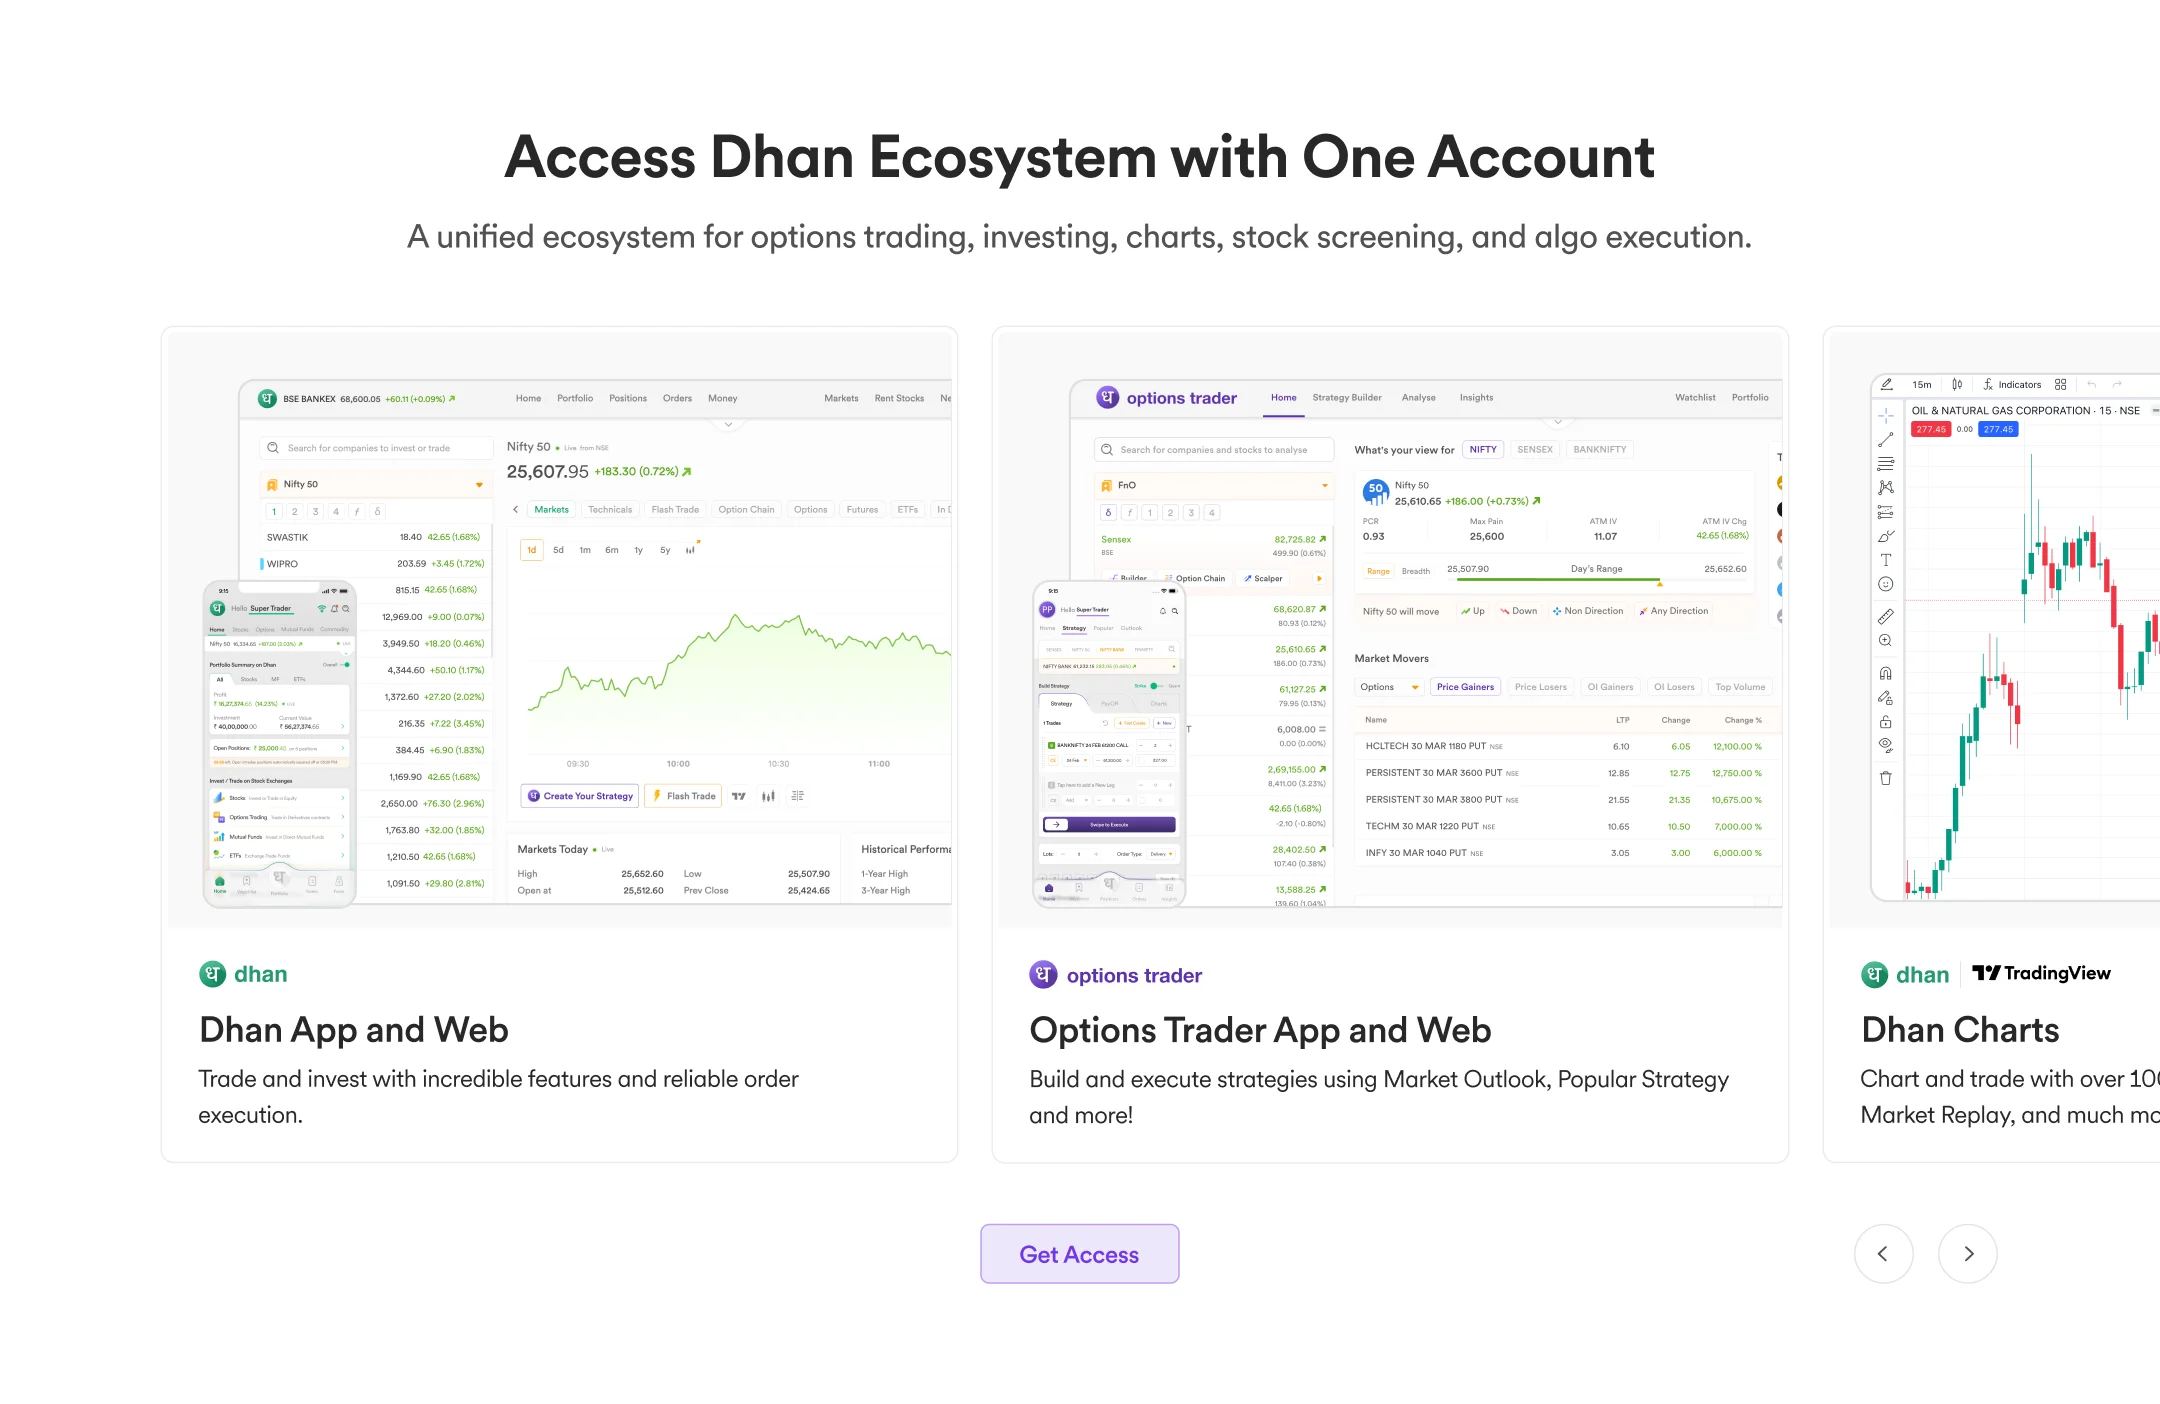
All the products of the Dhan ecosystem
Goal: Answer "is this company serious?" Show that opening one account unlocks a family of integrated platforms, not just one app.
Flat grid mockups were scrapped generic SaaS layouts that did nothing to signal the scale of the platform.
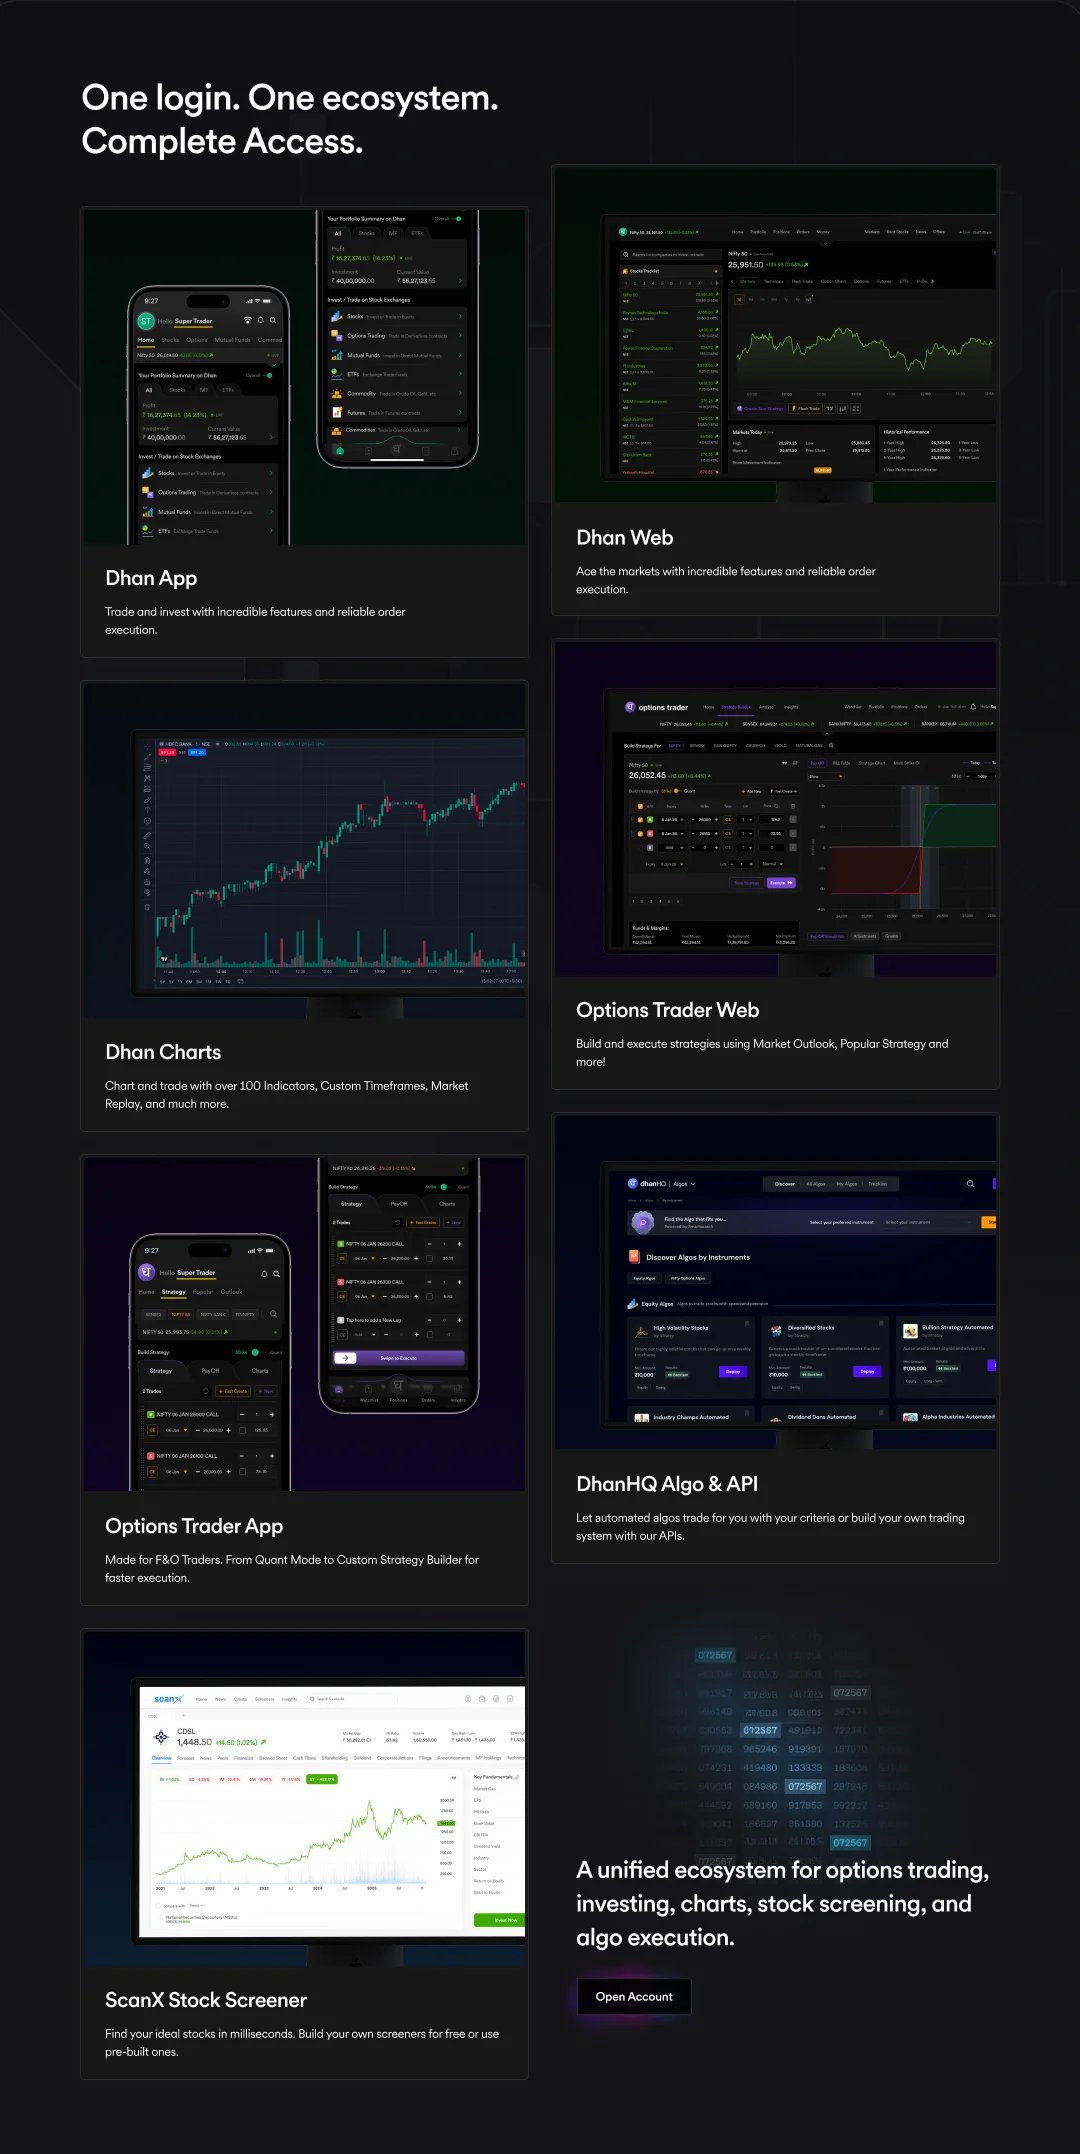
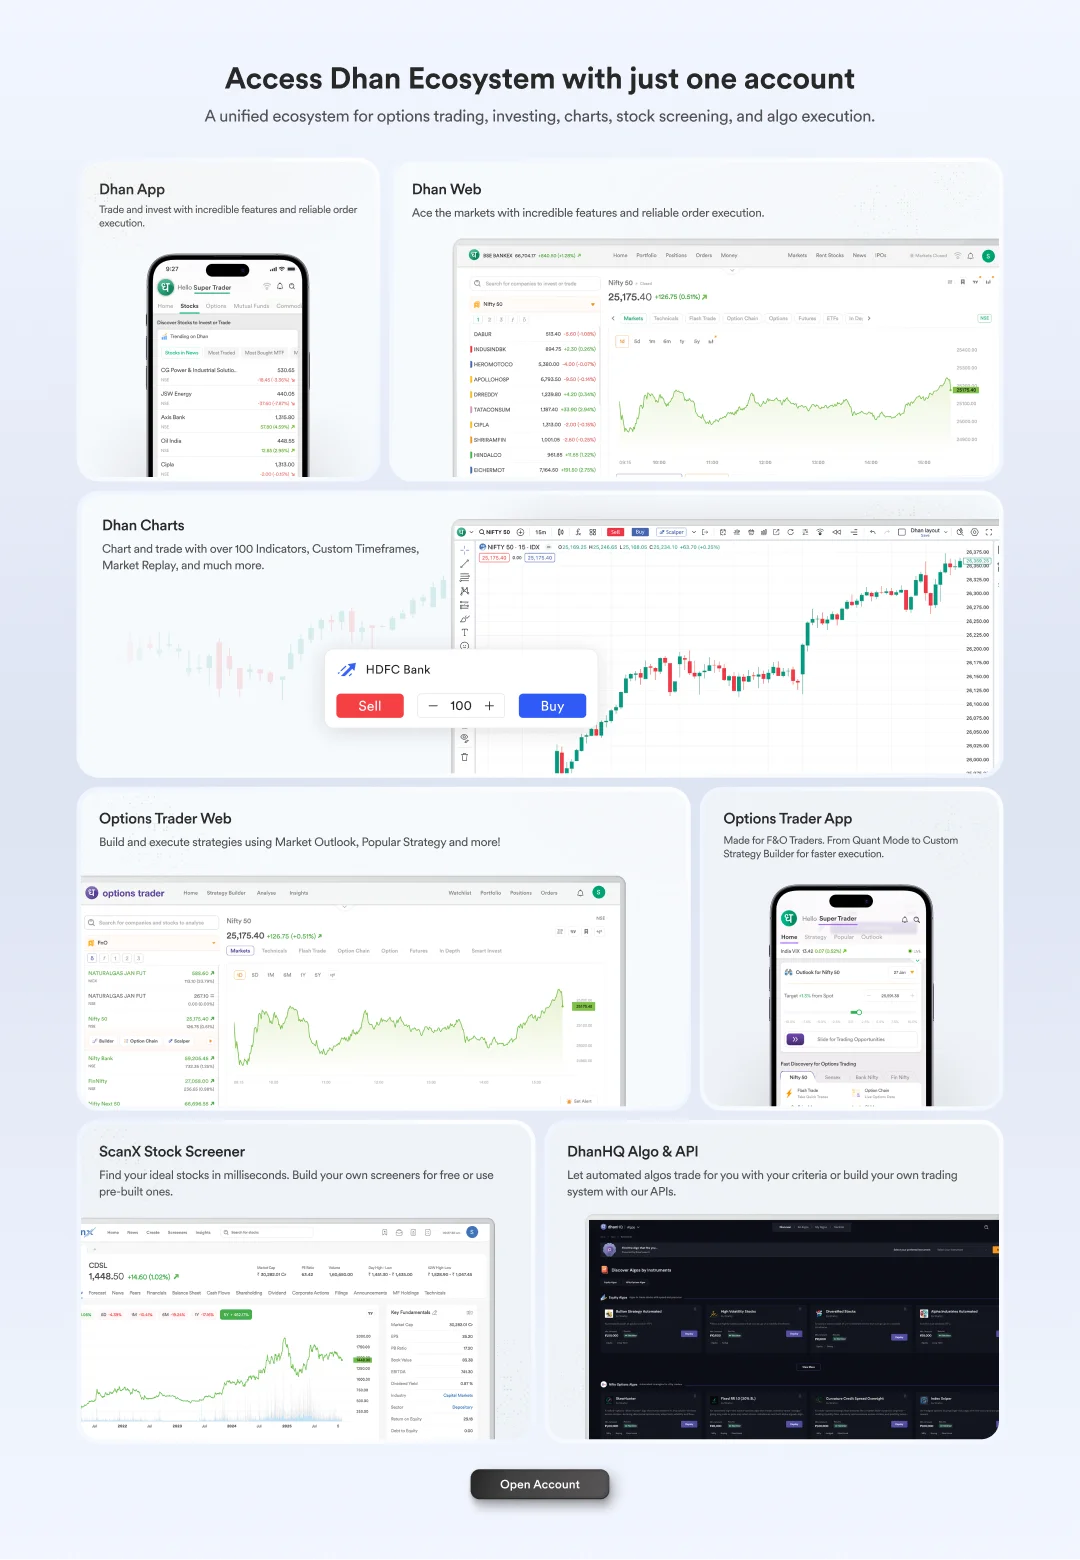
Final: Each product gets its own card an actual screenshot of its live interface, paired with the product logo, name, and a single-line description of what it does. Laid out as a horizontal carousel, a user can scan the full Dhan ecosystem in one pass without leaving the page. Real product UI, no renders, no fluff.
Behind the landing page
The landing page makes a specific promise: see the real product before signing up. So the case study has to cover the real product. Every screen below is live in production today at options-trader.co - not a roadmap, not a render.
Two surfaces carry the heaviest design weight: the Strategy Builder and the Option Chain. They get the deep dive. Seven supporting tools ship alongside them under the Analyse and Insights menus - gathered into a gallery below.
Strategy Builder - payoff-first construction
An F&O trader thinks in payoff diagrams. They picture the curve first, then back into the legs. The Strategy Builder mirrors that mental model: inputs on the left, the live payoff chart on the right, both moving in lockstep. Add a leg - the curve redraws. Drag a strike - the breakeven shifts. Probable P&L and breakeven flags overlay the chart so the trader never has to context-switch to a calculator.
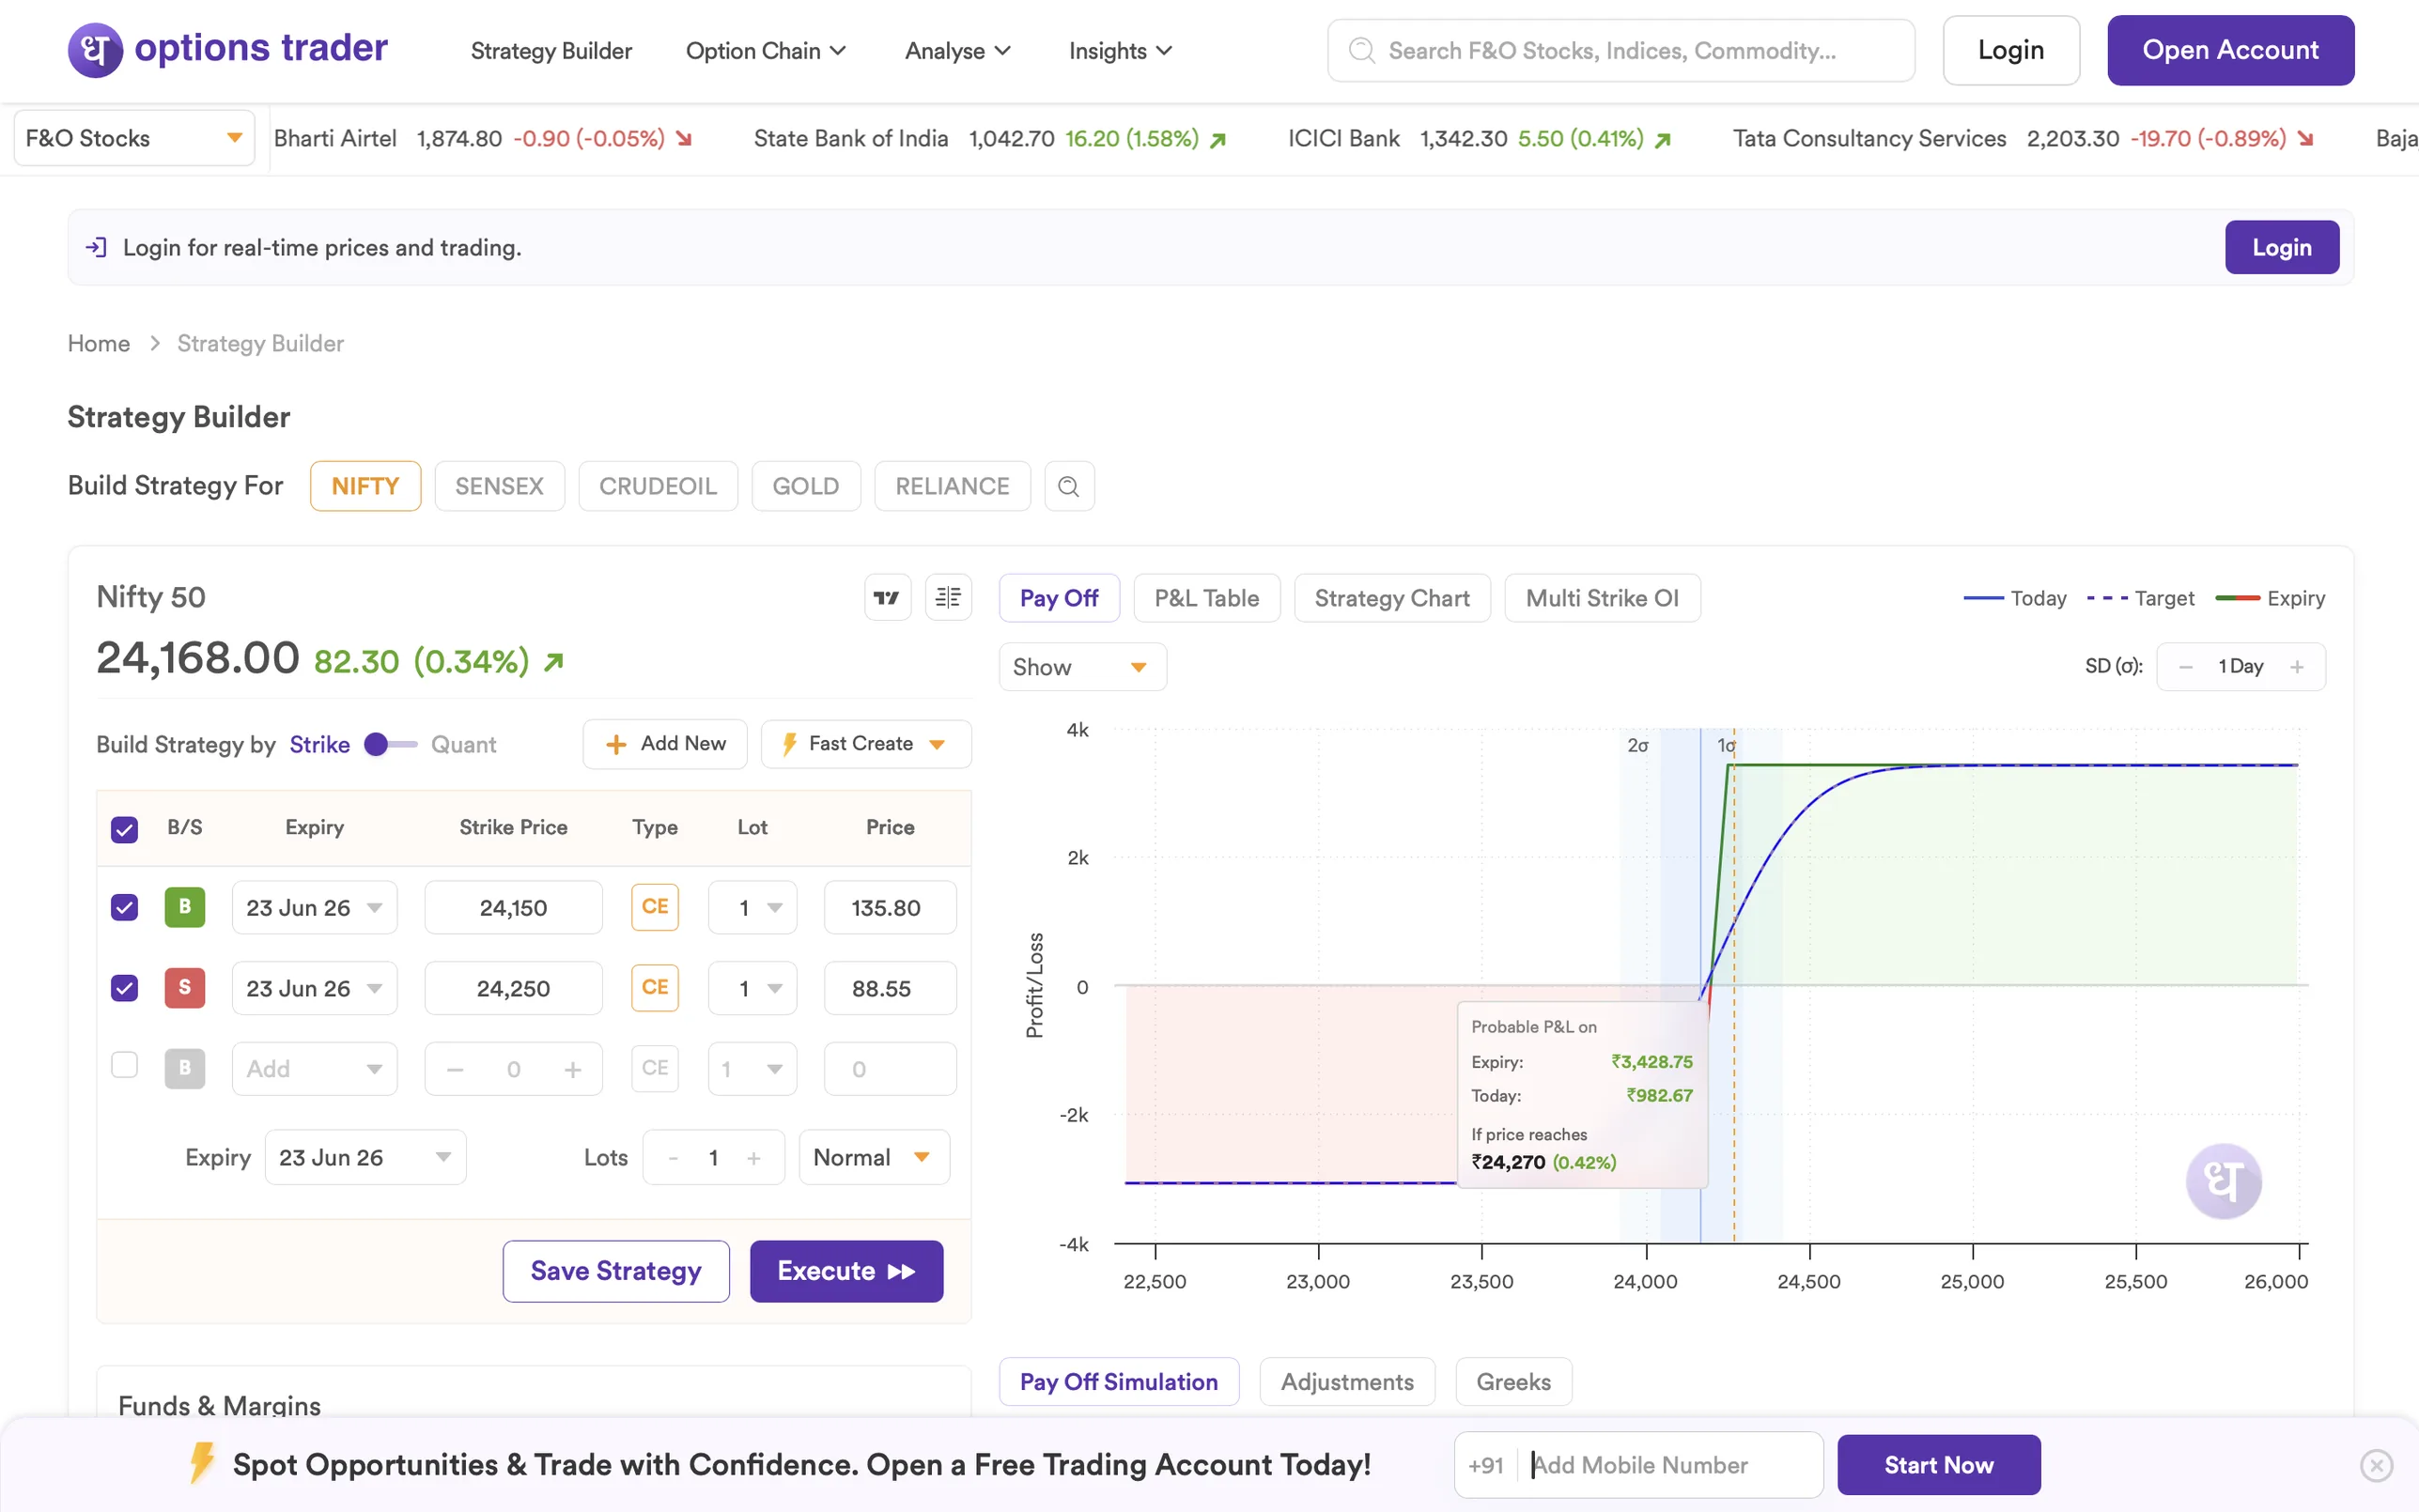
Why two columns: putting the chart on the right means every change to the legs immediately shows on the chart without scrolling. The tabbed strip above the chart (Pay Off / P&L Table / Strategy Chart / Multi Strike OI) compresses a normally-multi-page workflow into one screen - the same data, four different reads, never more than a click away.
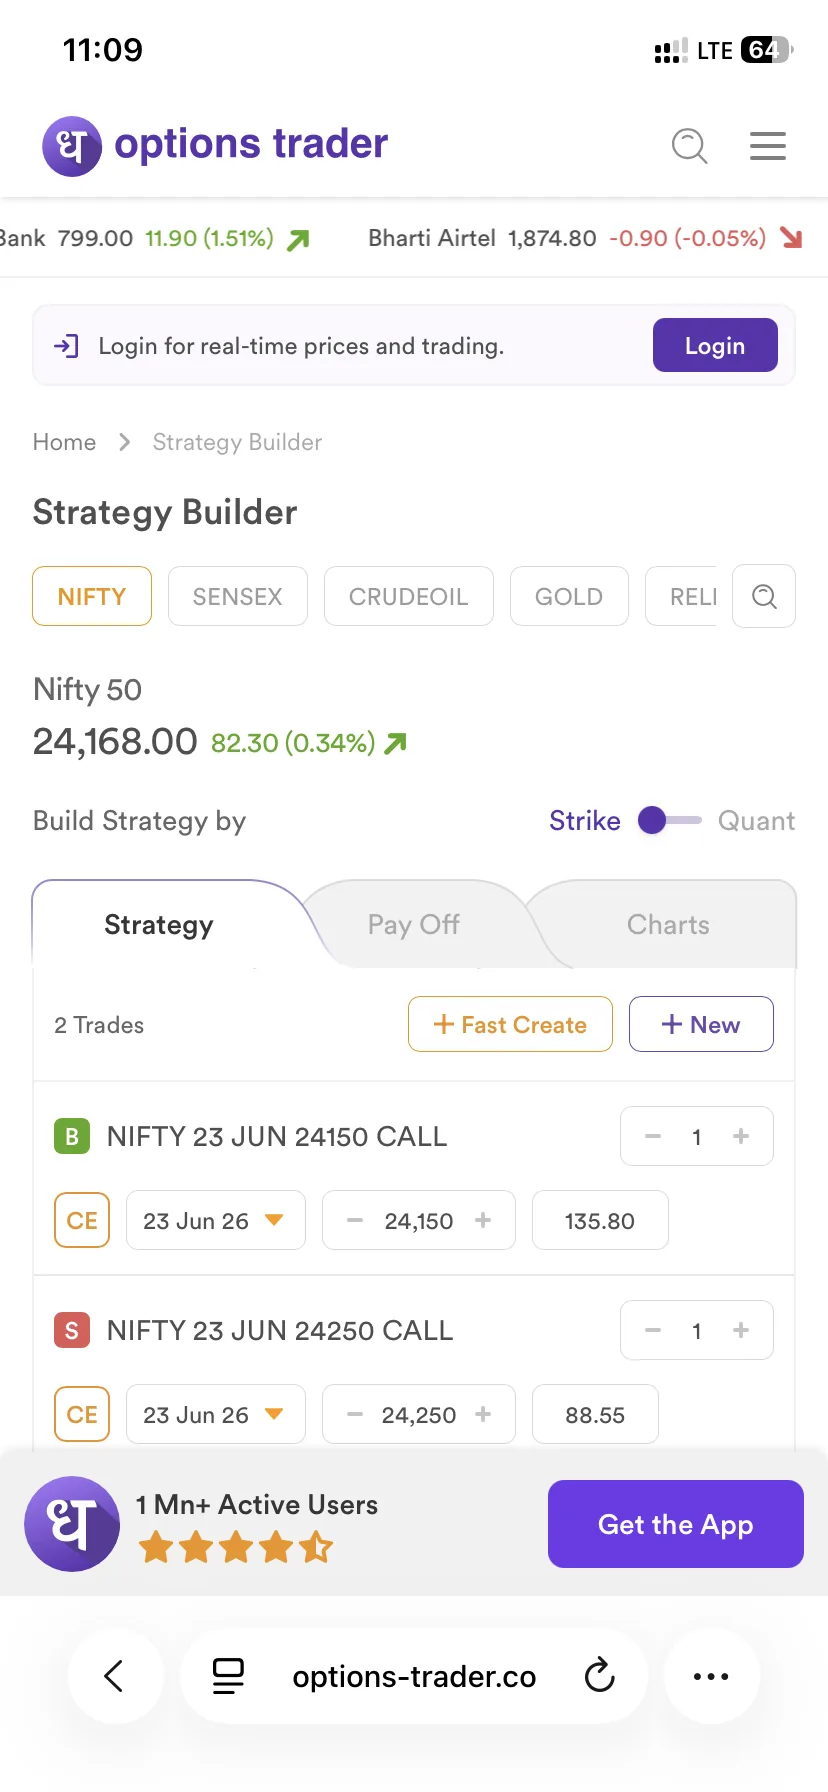
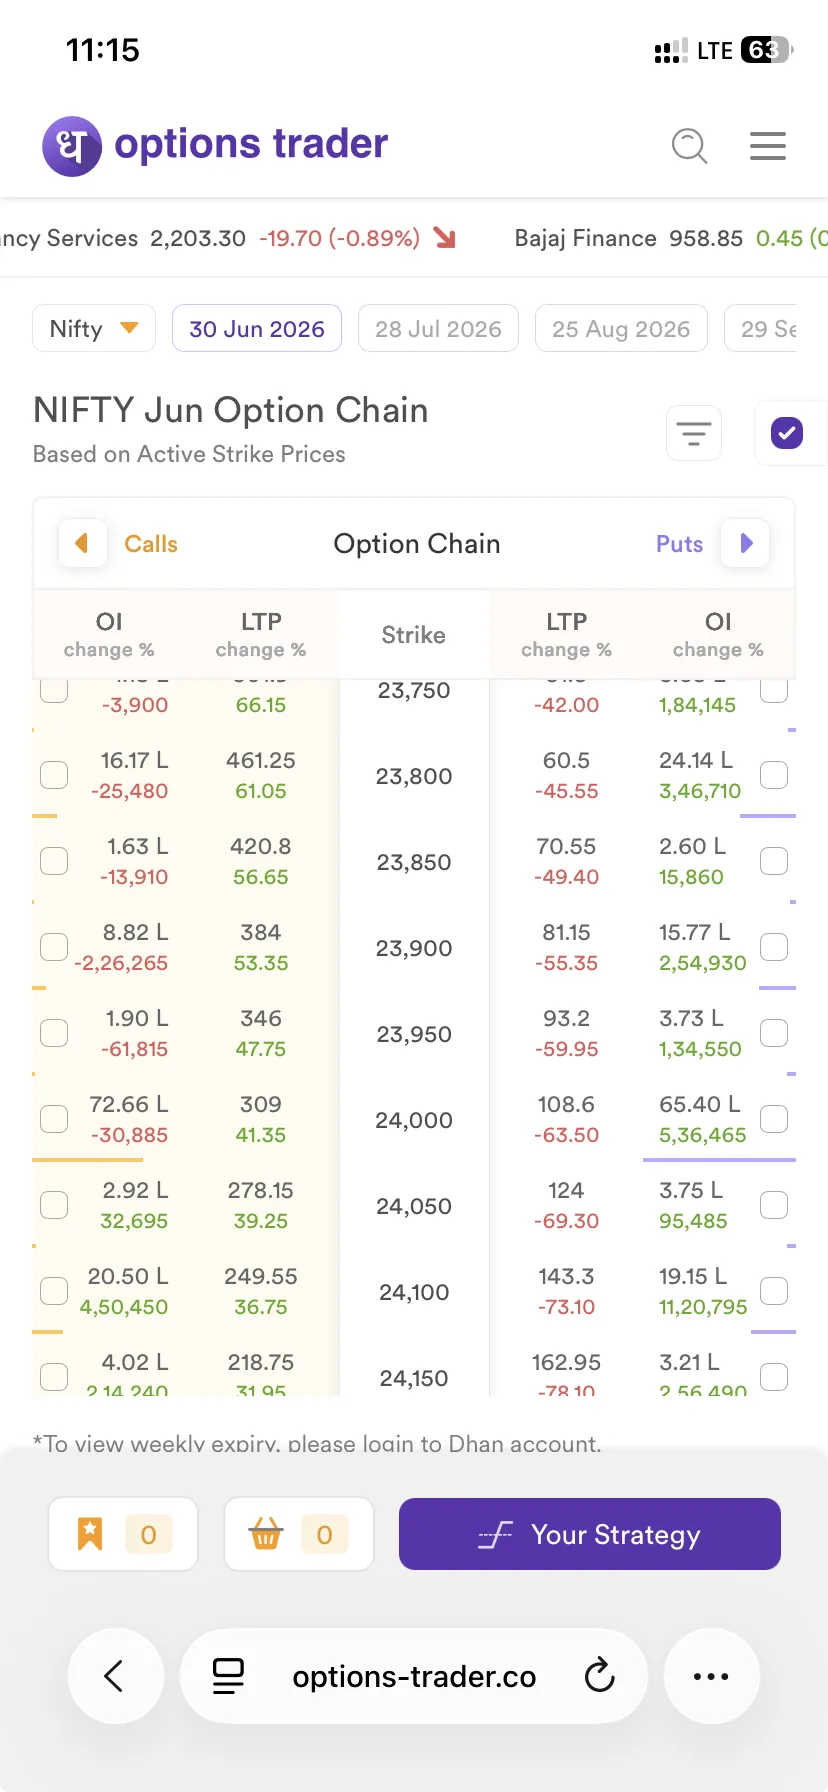
On mobile: the columns stack - strategy form on top, payoff chart accessible via the tab strip. A persistent “1 Mn+ Active Users · Get the App” pill anchors the conversion path. Web is for research; execution belongs in the app, and the design admits it.
Option Chain - density on purpose
Option chains are dense. The design choice here is to not hide that density. Eight columns per side, calls on the left and puts on the right, strike prices anchored in the middle - the ladder a trader actually scans. LTP, LTP change, OI, OI change %, volume, IV, PCR. Color-coded change cells (green up, red down) so the eye lands on movement before it lands on numbers.
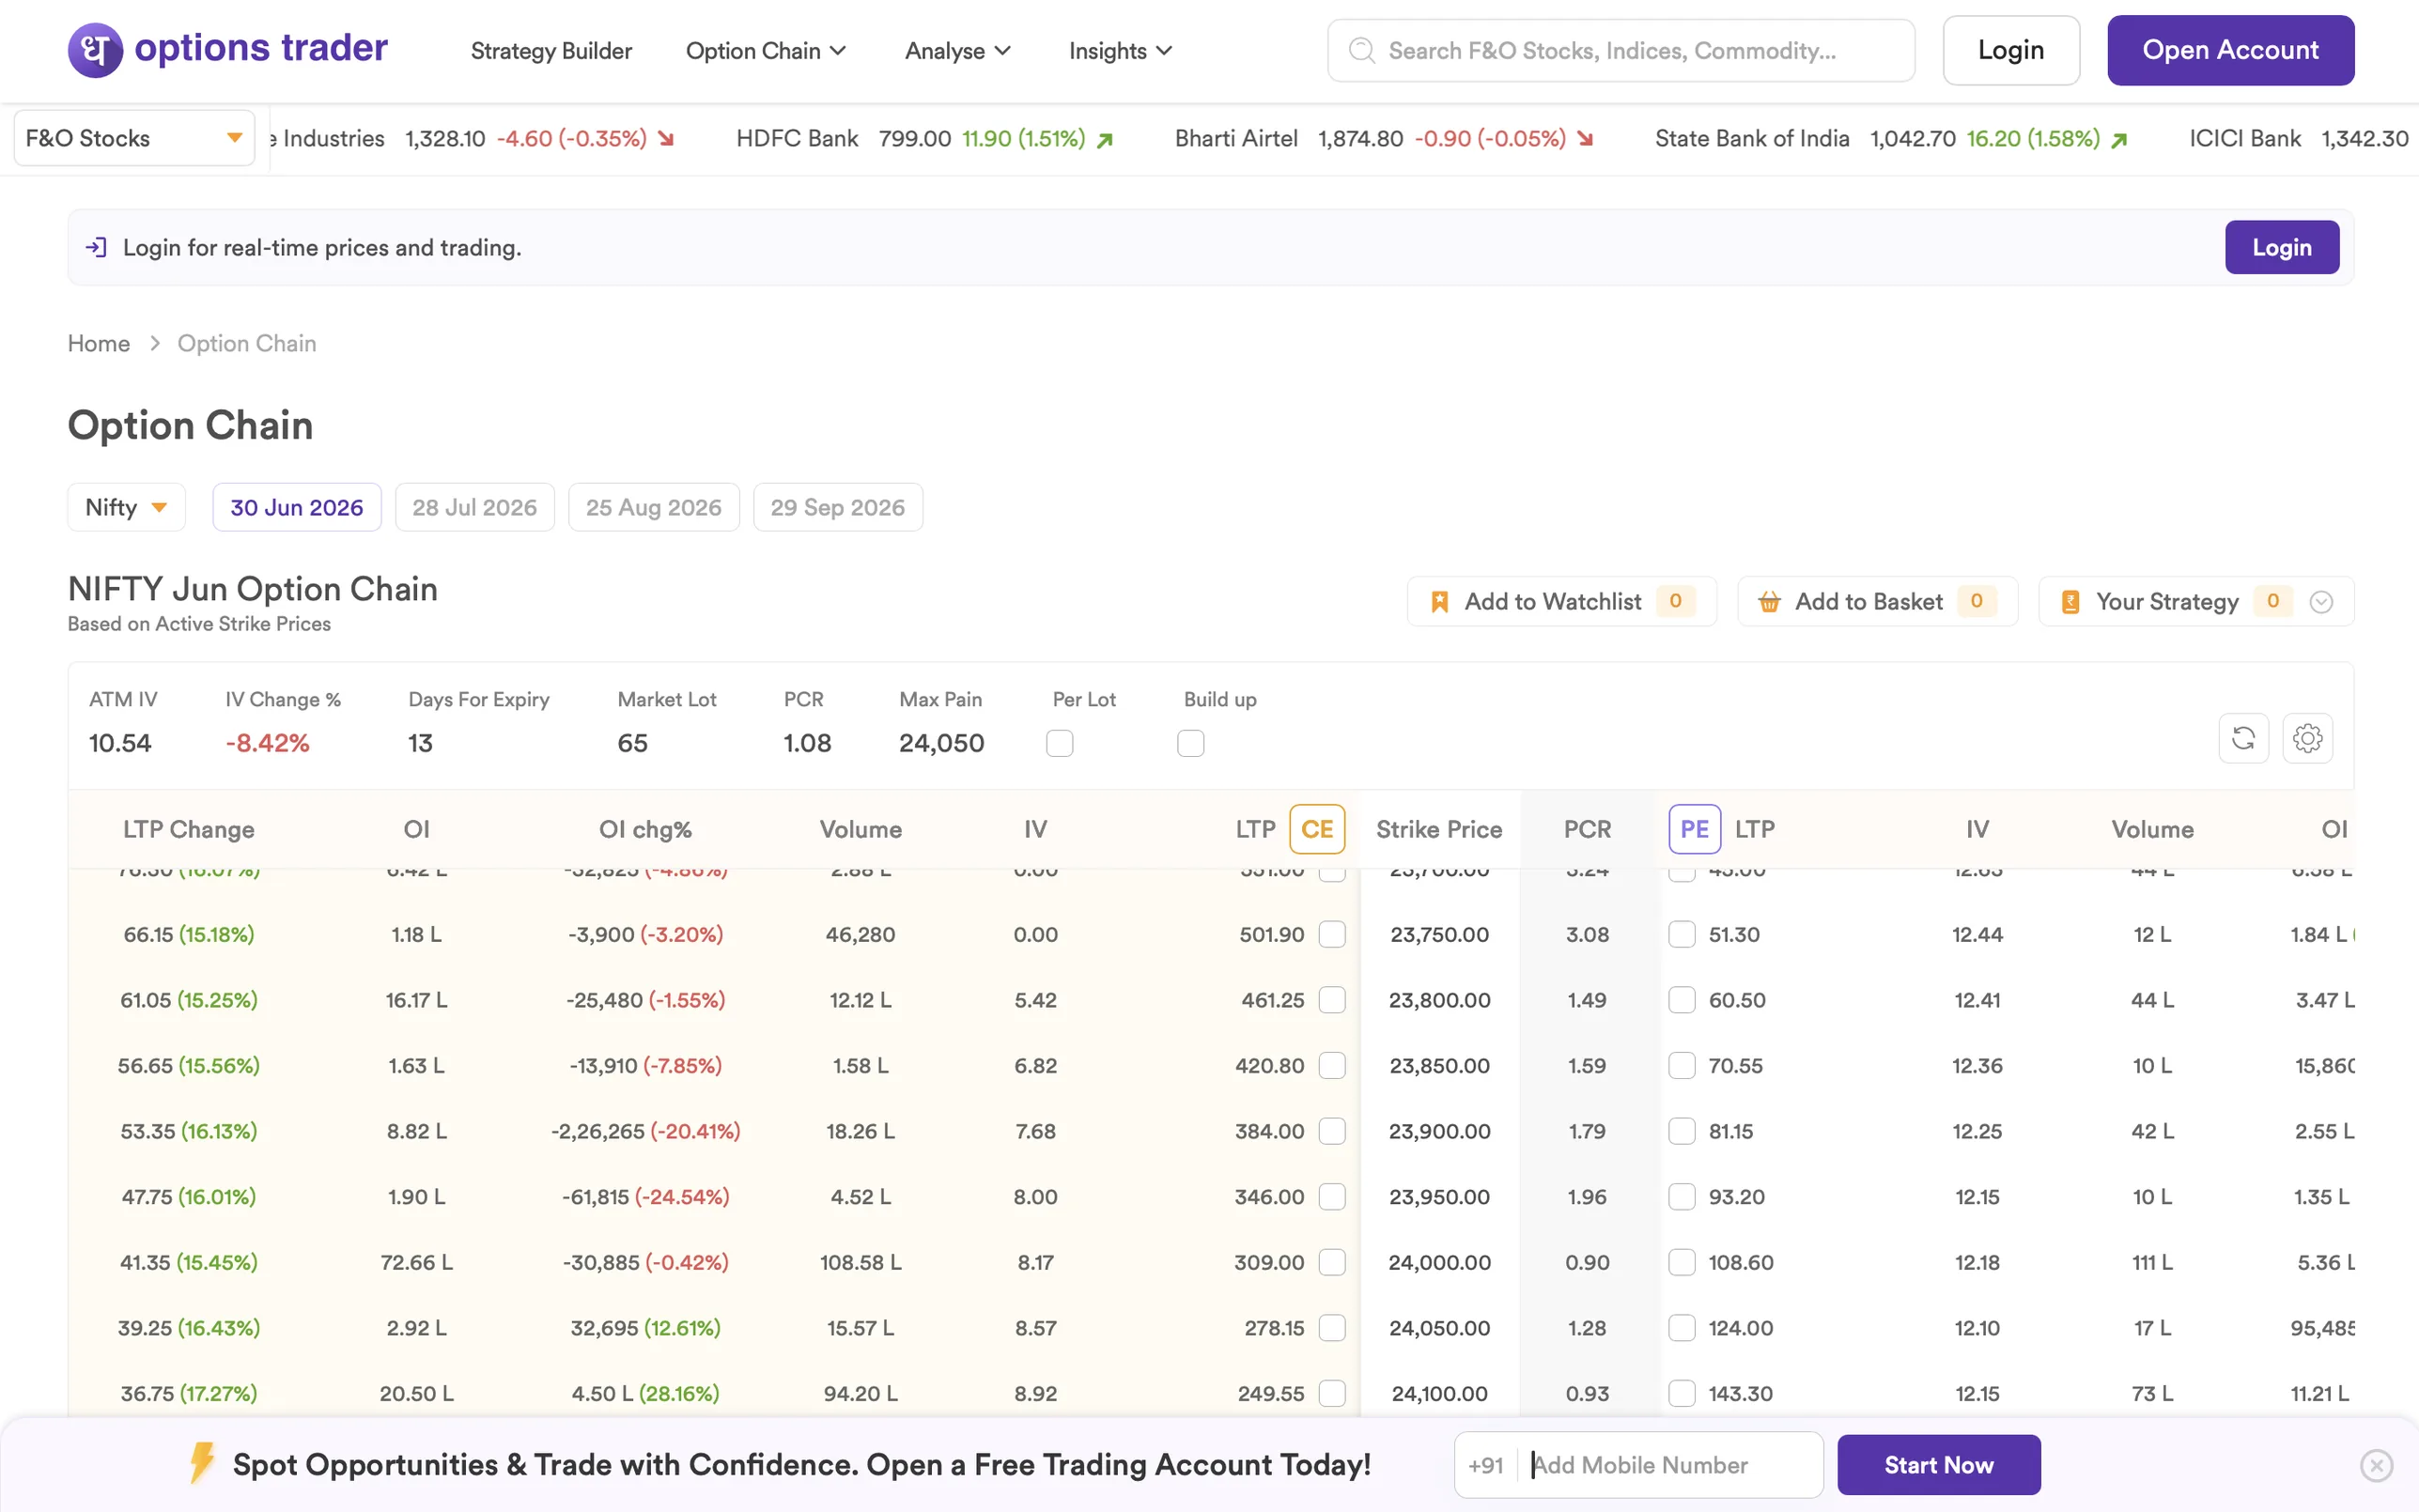
Summary strip on top: ATM IV, IV Change %, Days For Expiry, Market Lot, PCR, Max Pain, Per Lot, Build up. These are the chain-level numbers traders normally compute by eye - surfaced once, so the body of the chain stays a pure data grid.
From viewing tool to launching tool: Add to Watchlist / Add to Basket / Your Strategy live in the top-right. Selected strikes go straight into a strategy or a watchlist - the chain stops being a place you look at and becomes a place you act from.
Seven more tools, one question each
Beyond the chain and the builder, the platform ships seven supporting tools under Analyse and Insights. Each one answers a single question the trader is actually asking - not a generic dashboard, not a kitchen-sink screen.
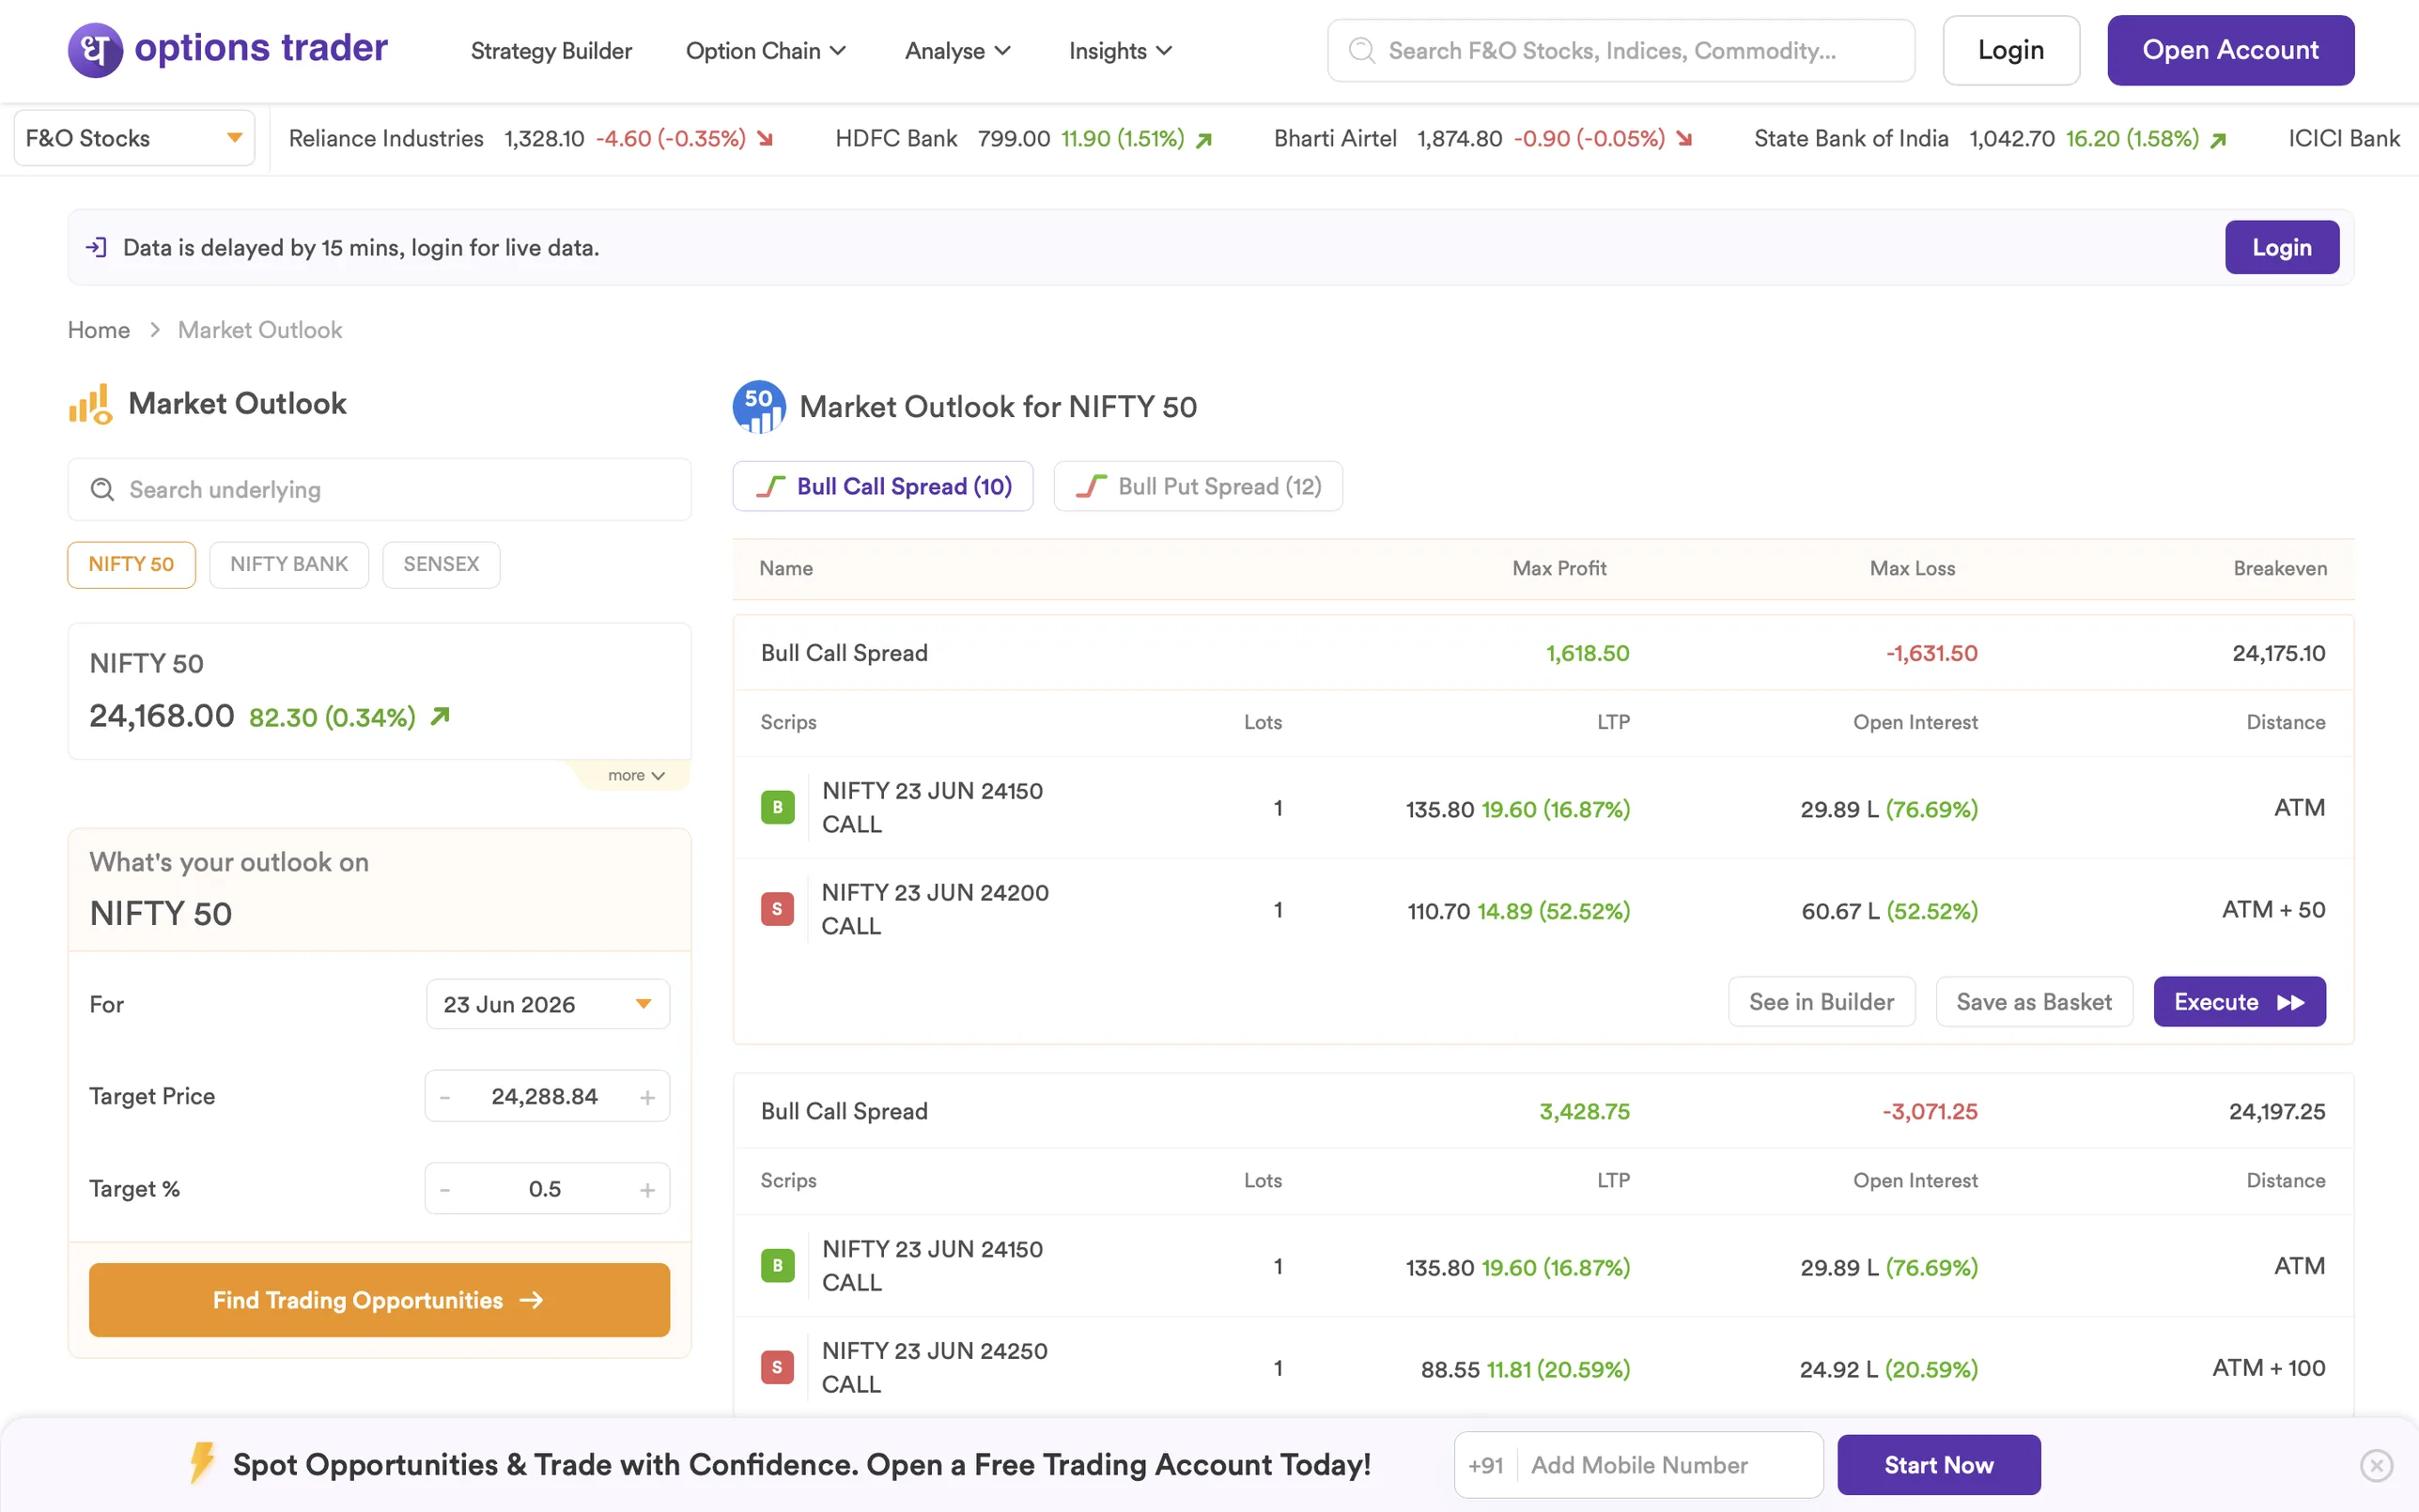
Market Outlook - “What if I think NIFTY goes to X?”
Pick an underlying, set a target price and a date, and the screen returns bull/bear spreads ranked by risk-reward. Translates a directional view into a ready-to-execute spread without the trader needing to know which strikes to pick.
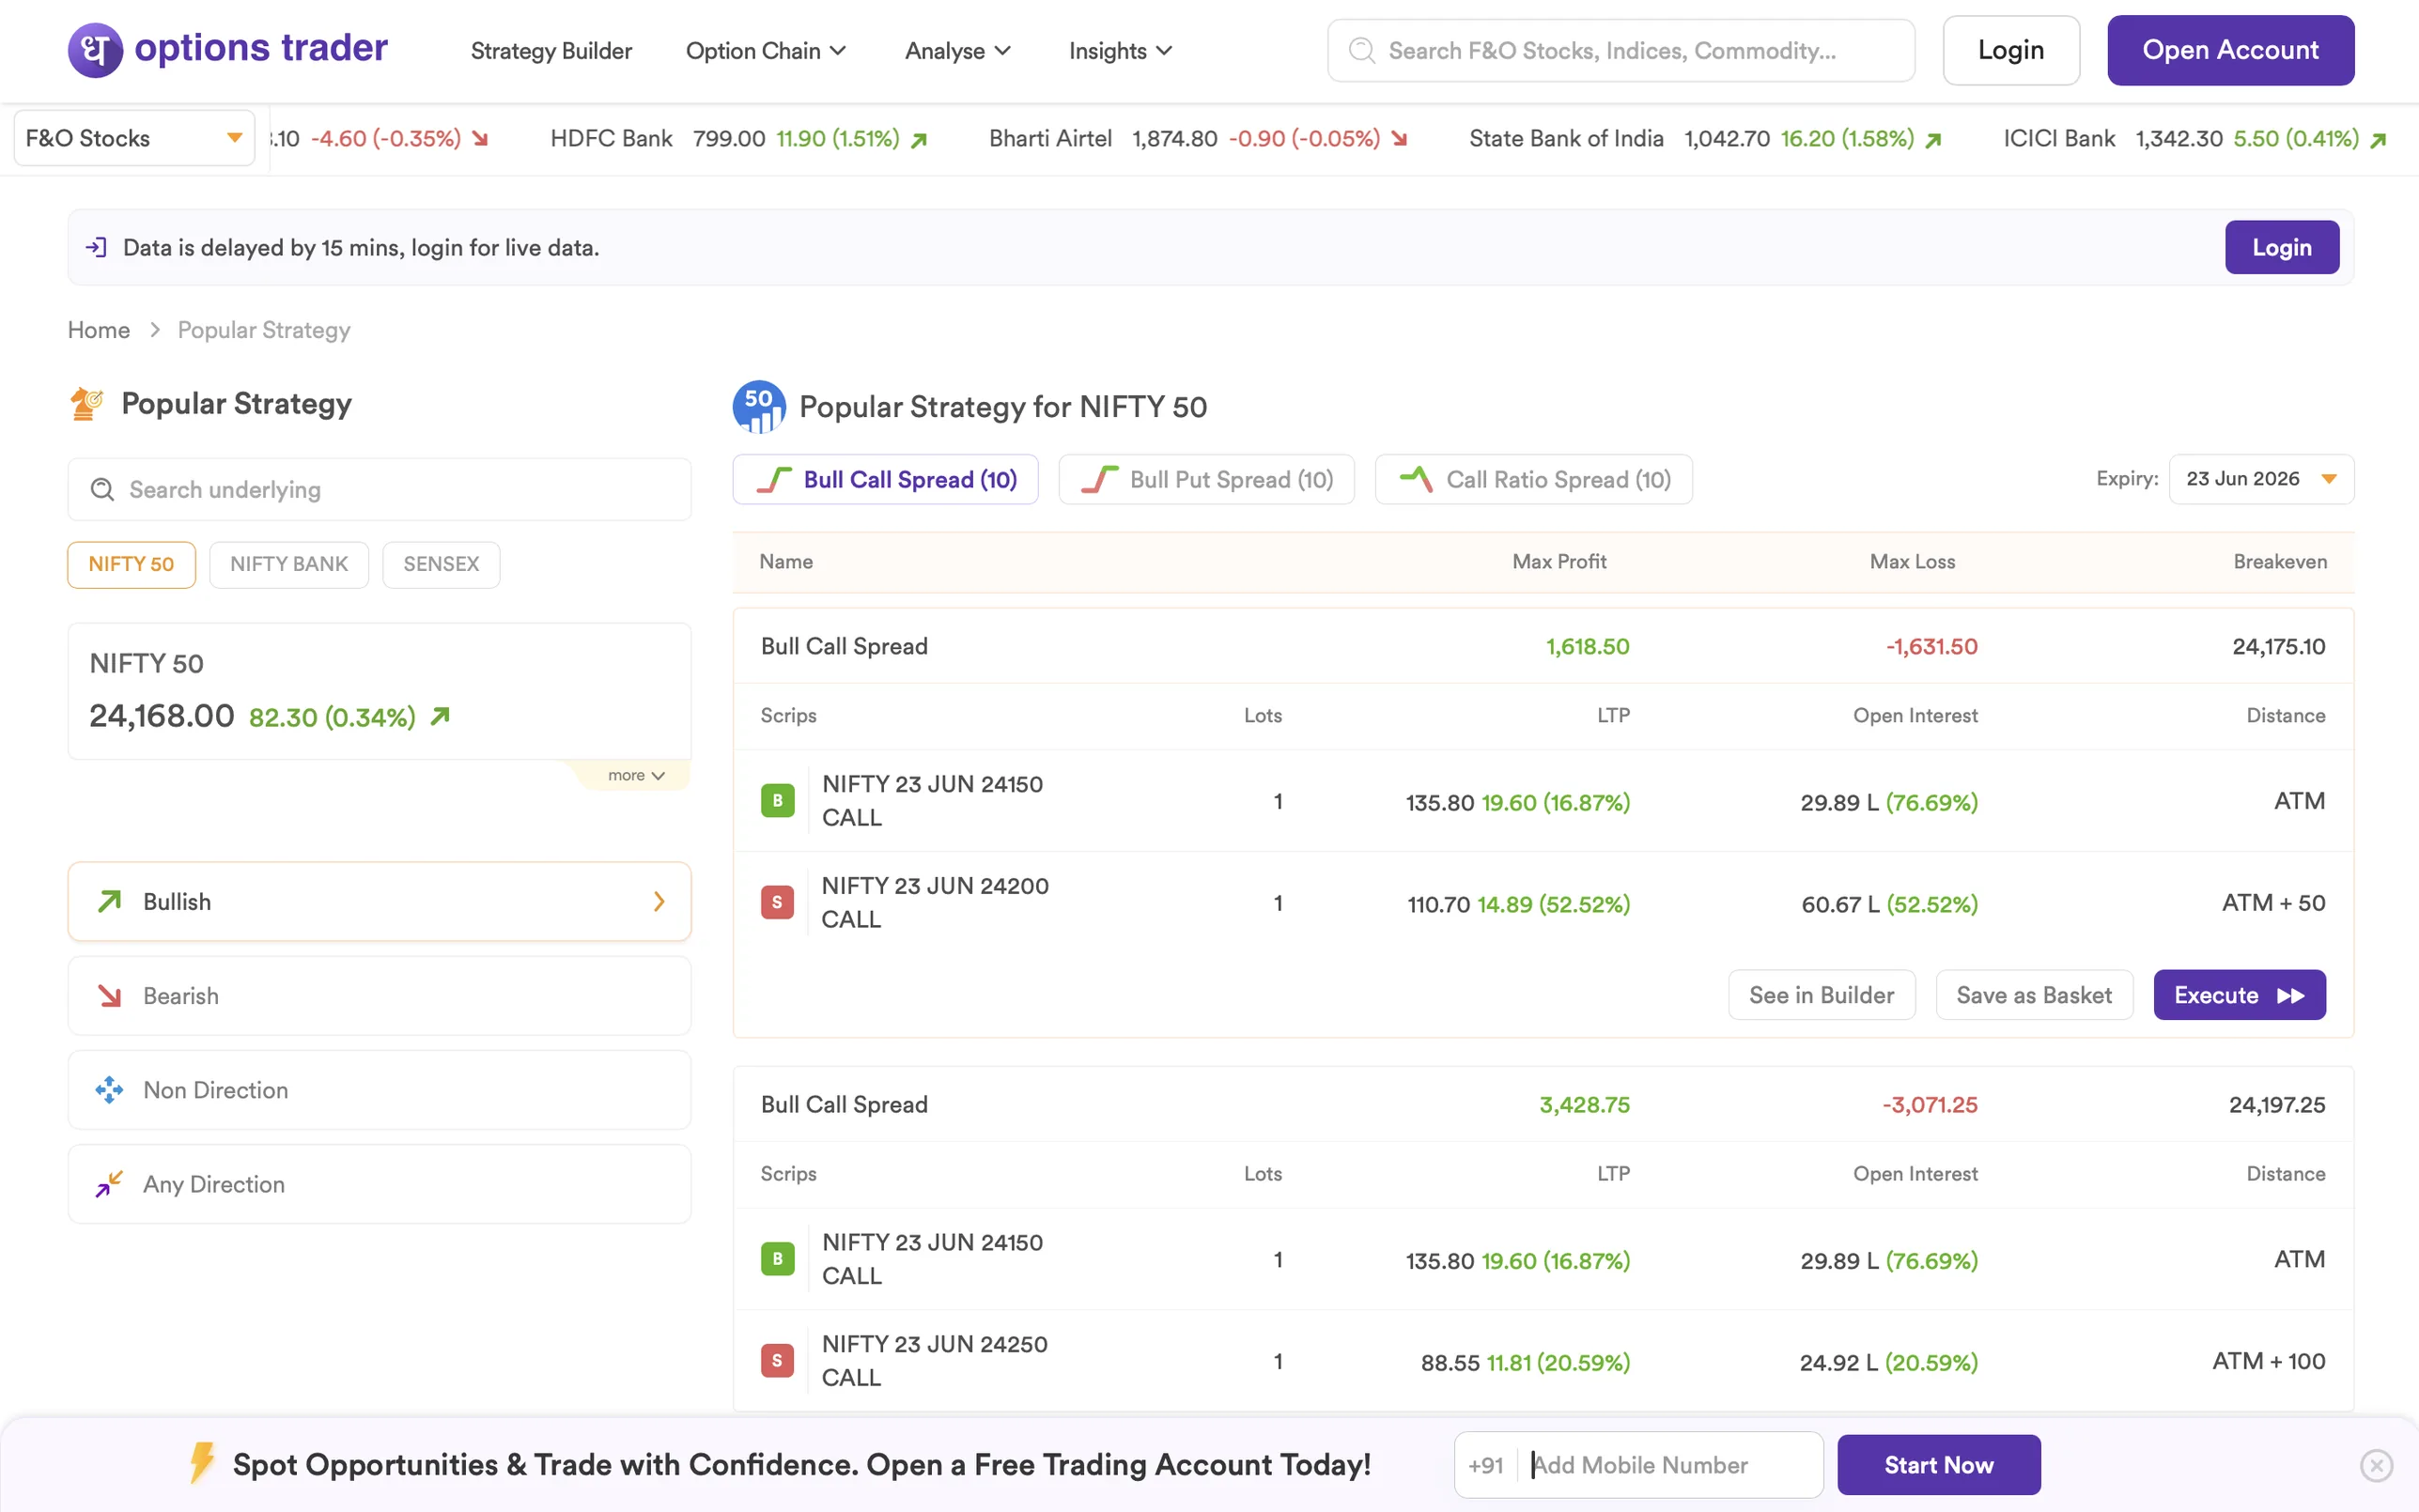
Popular Strategy - “Which spread expresses what I think?”
Pre-canned strategies grouped by directional bias - Bullish, Bearish, Non Direction, Any Direction. One click reveals the legs, max profit, max loss, breakeven. Lowers the bar for traders who know their view but not which structure carries it best.
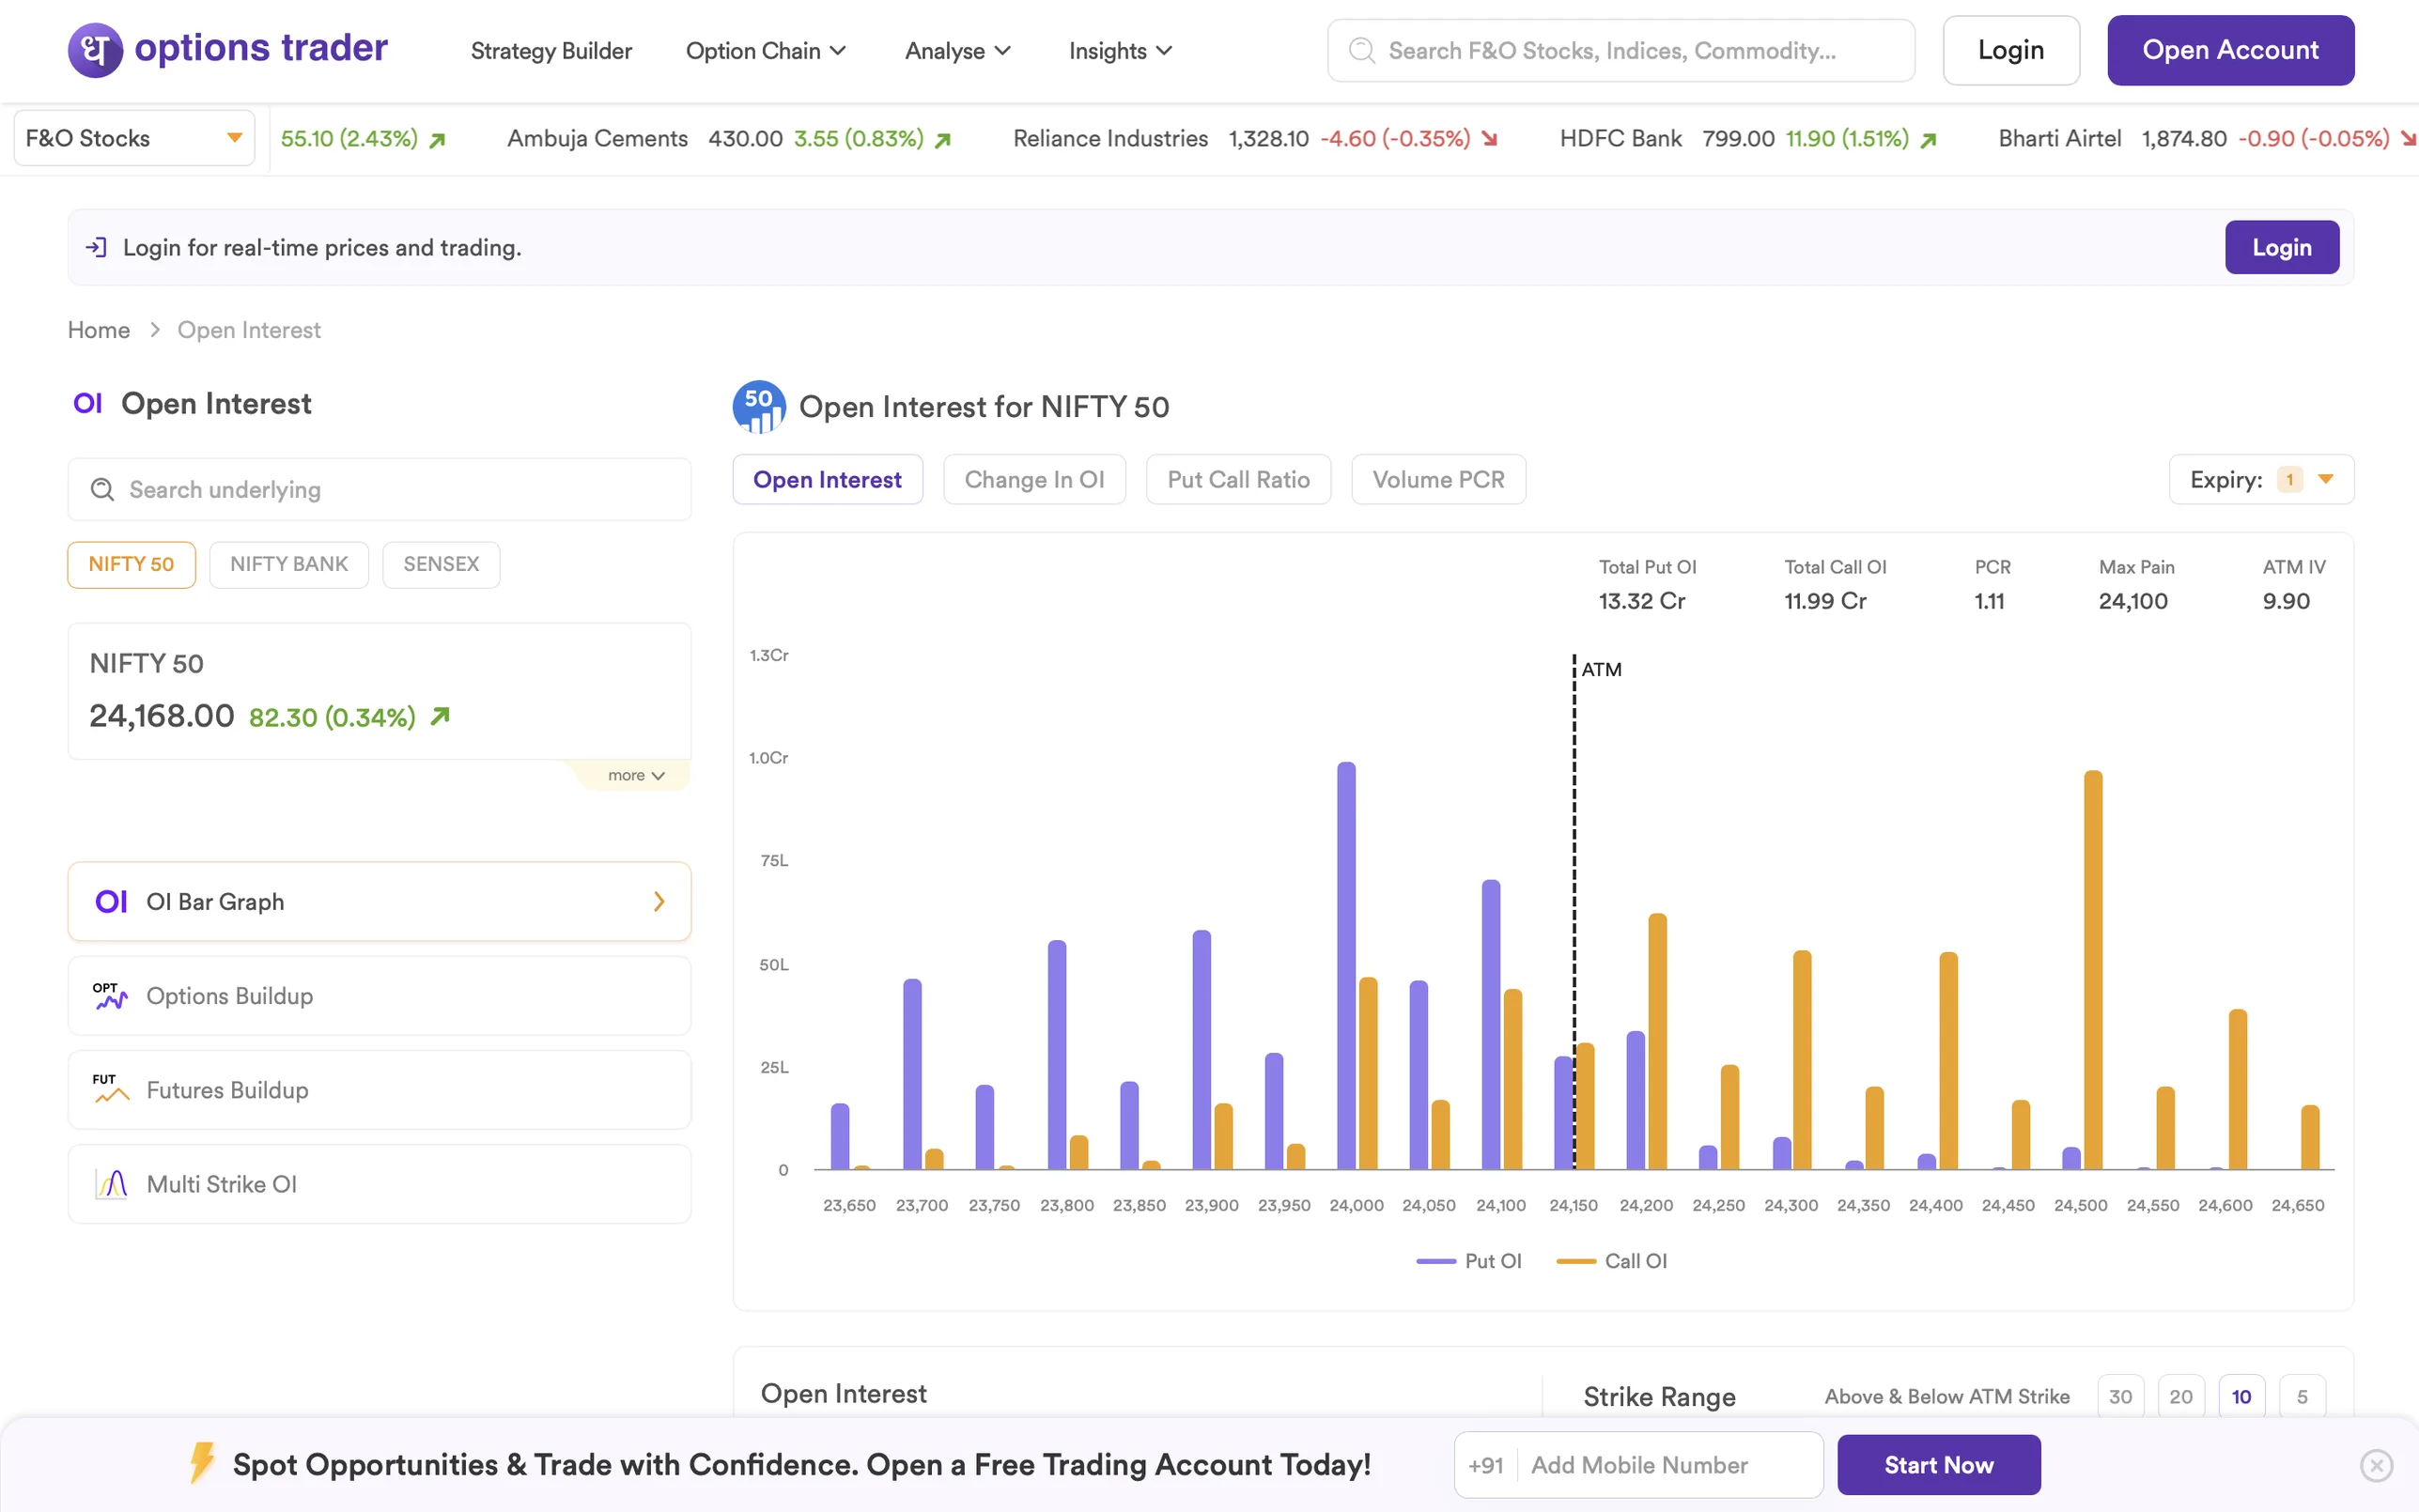
Open Interest - “Where is the smart money positioned?”
Strike-by-strike OI bar graph with the ATM line dashed across - calls in one color, puts in another. Tabs for Change in OI, Put Call Ratio, and Volume PCR sit above. The visual signal is immediate: where the bars cluster, the positioning is.
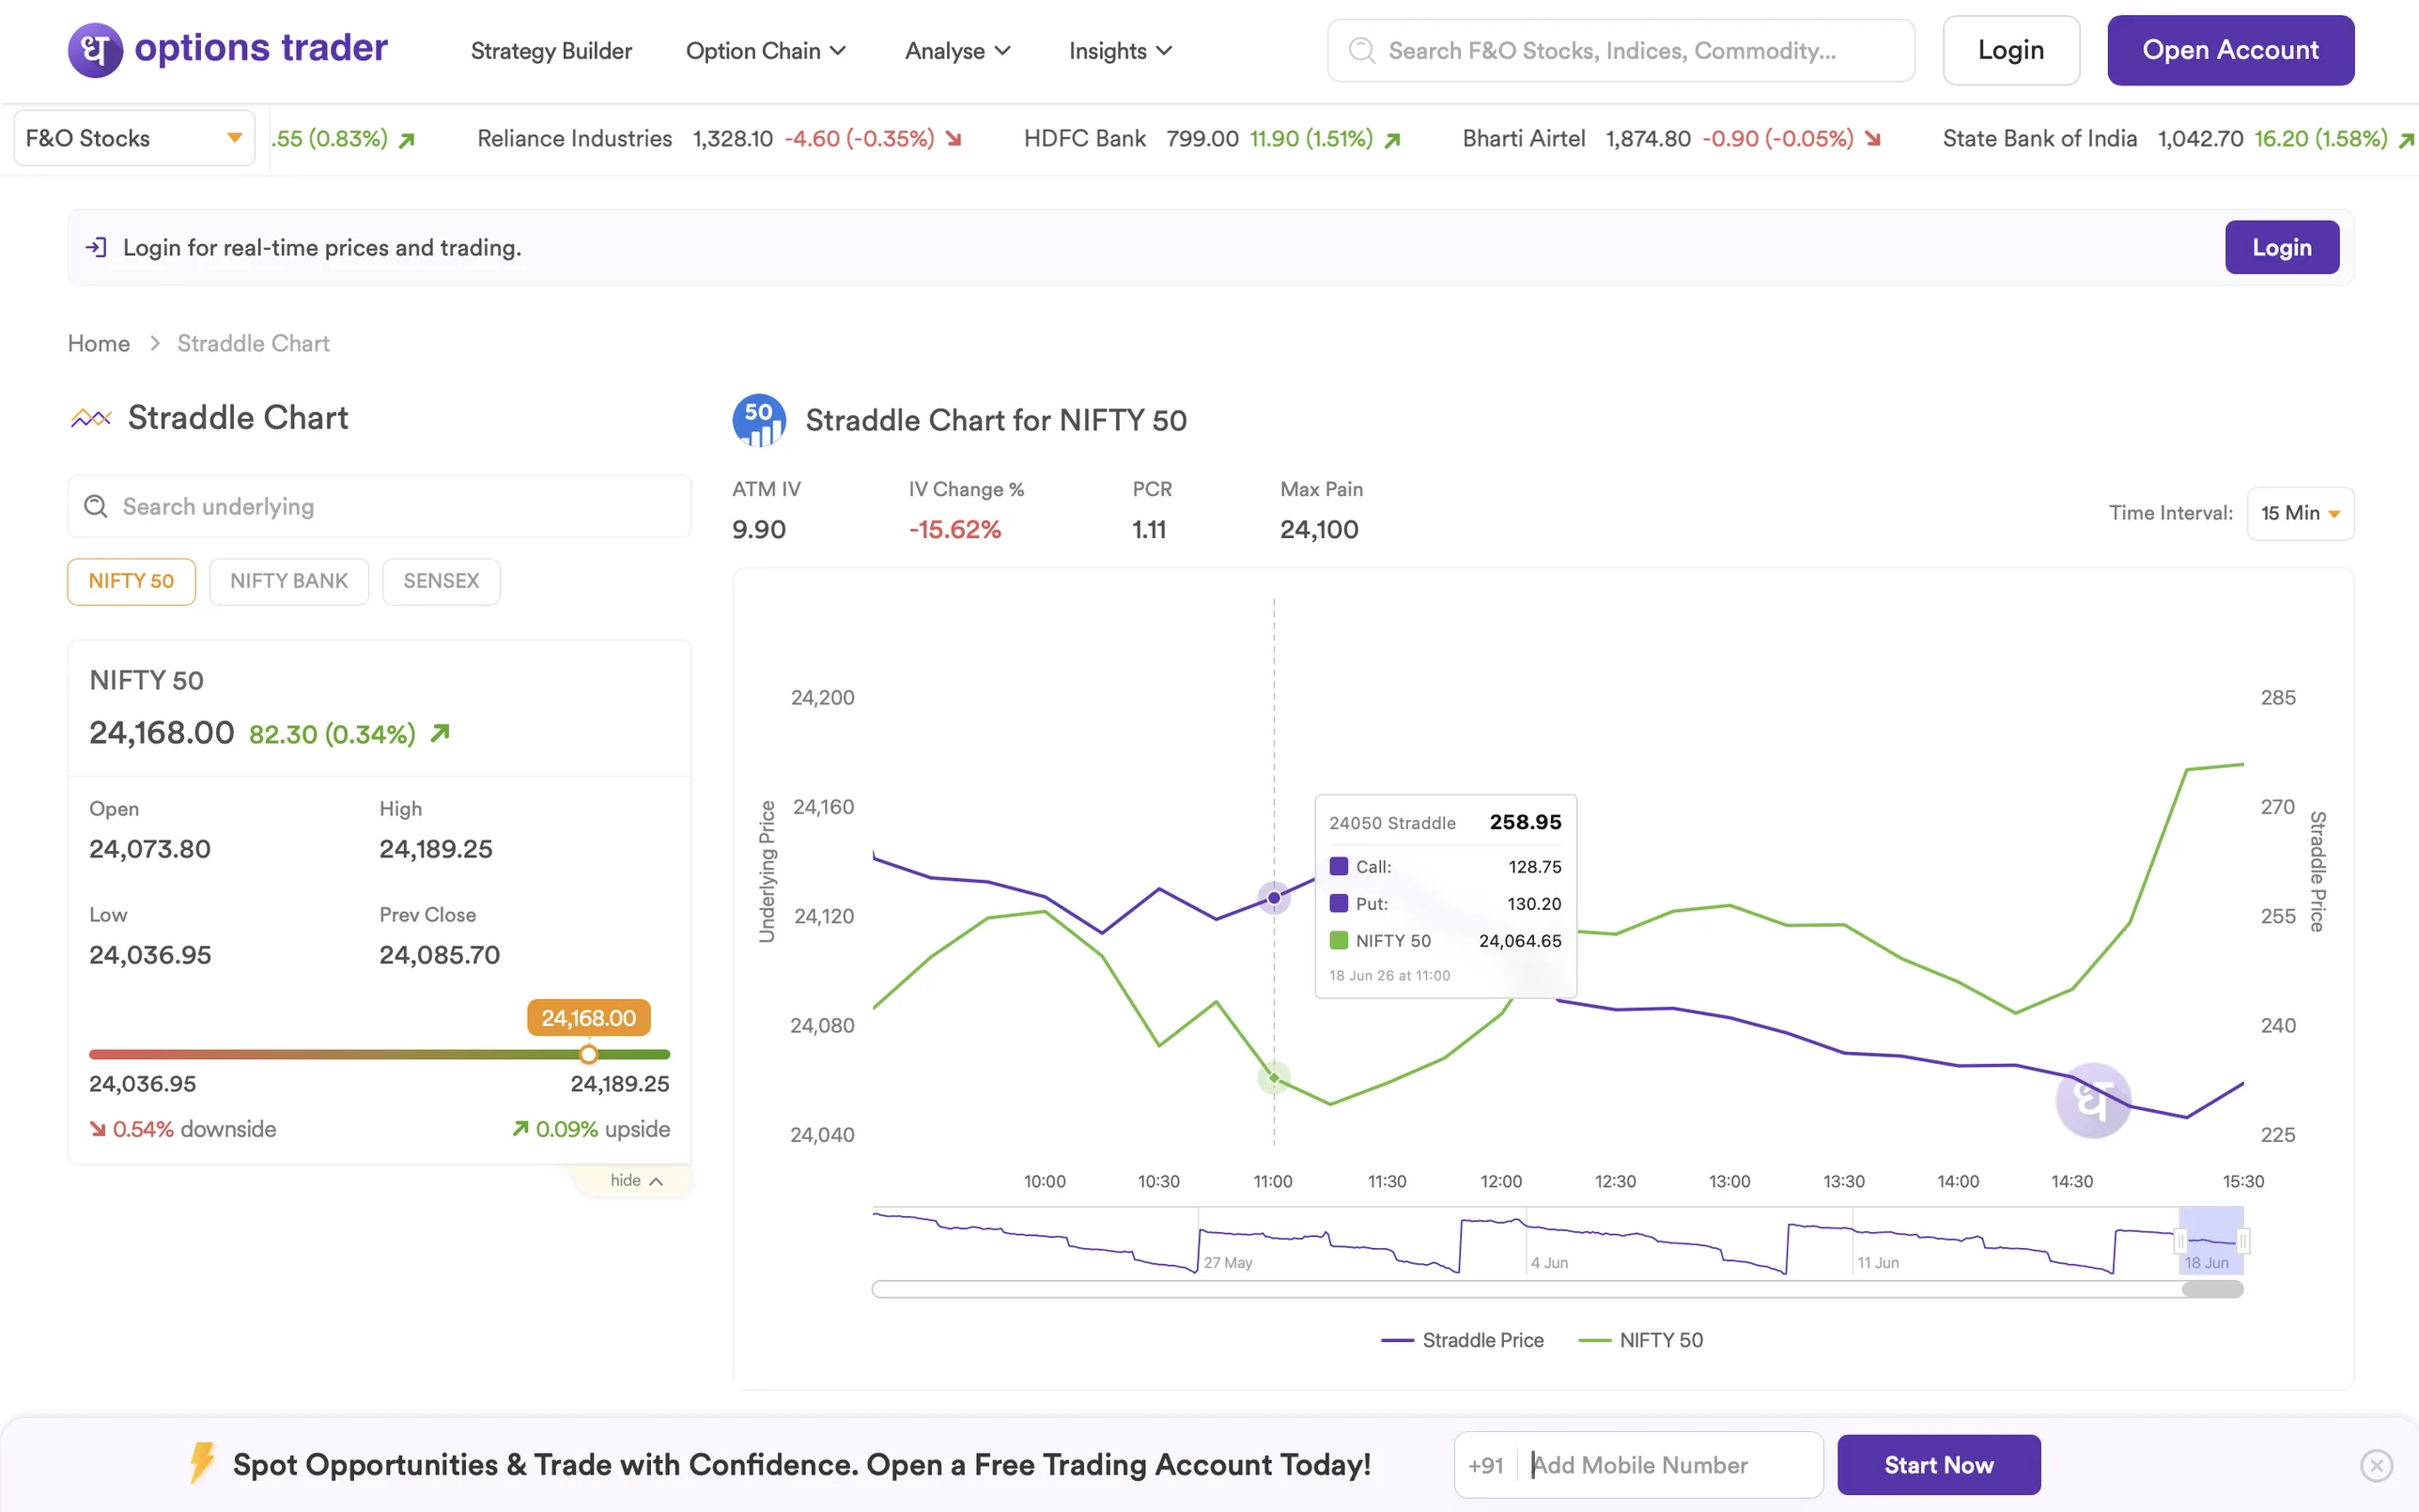
Straddle Chart - “Is volatility inflating premiums?”
ATM straddle price overlaid on the underlying, intraday. When the straddle moves independently of the underlying, premiums are inflating - the chart shows it before the chain reacts. Volatility traders time entries off this view.
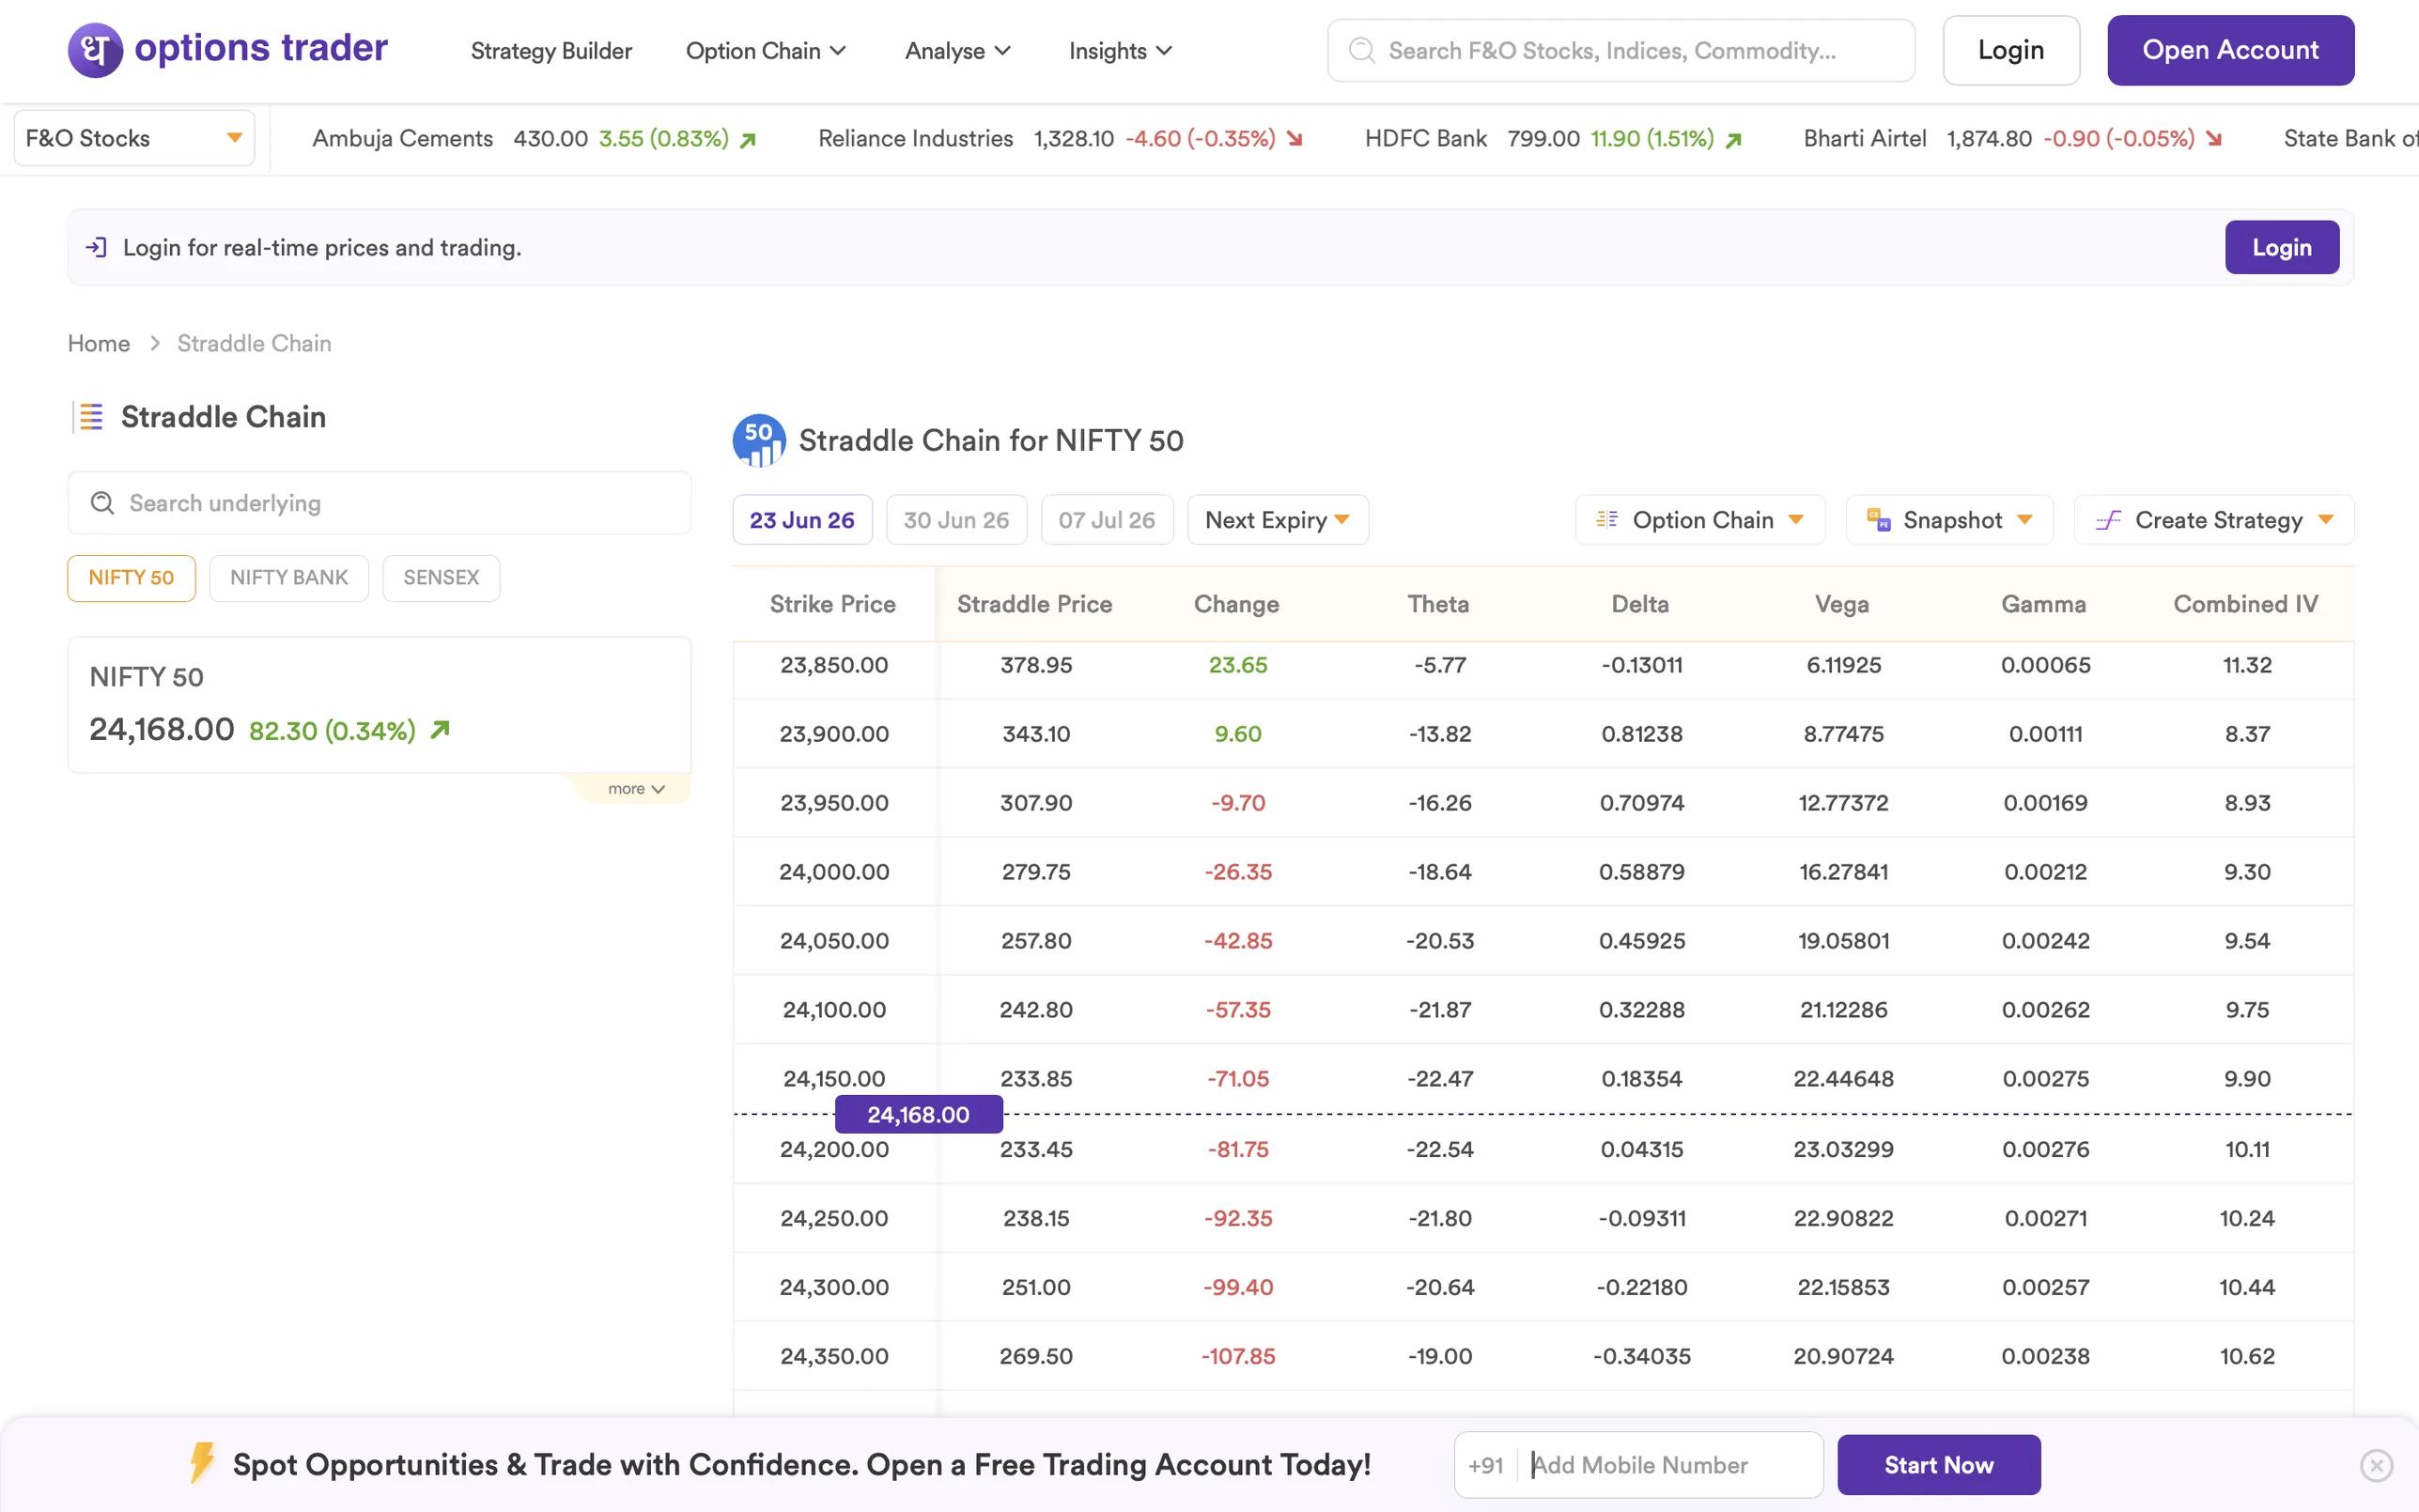
Straddle Chain - “Which strike is fairest priced?”
Strike-by-strike straddle prices with the Greeks beside them - Theta, Delta, Vega, Gamma, and Combined IV. The scannable companion to the chart: same data, table form, ATM strike highlighted.
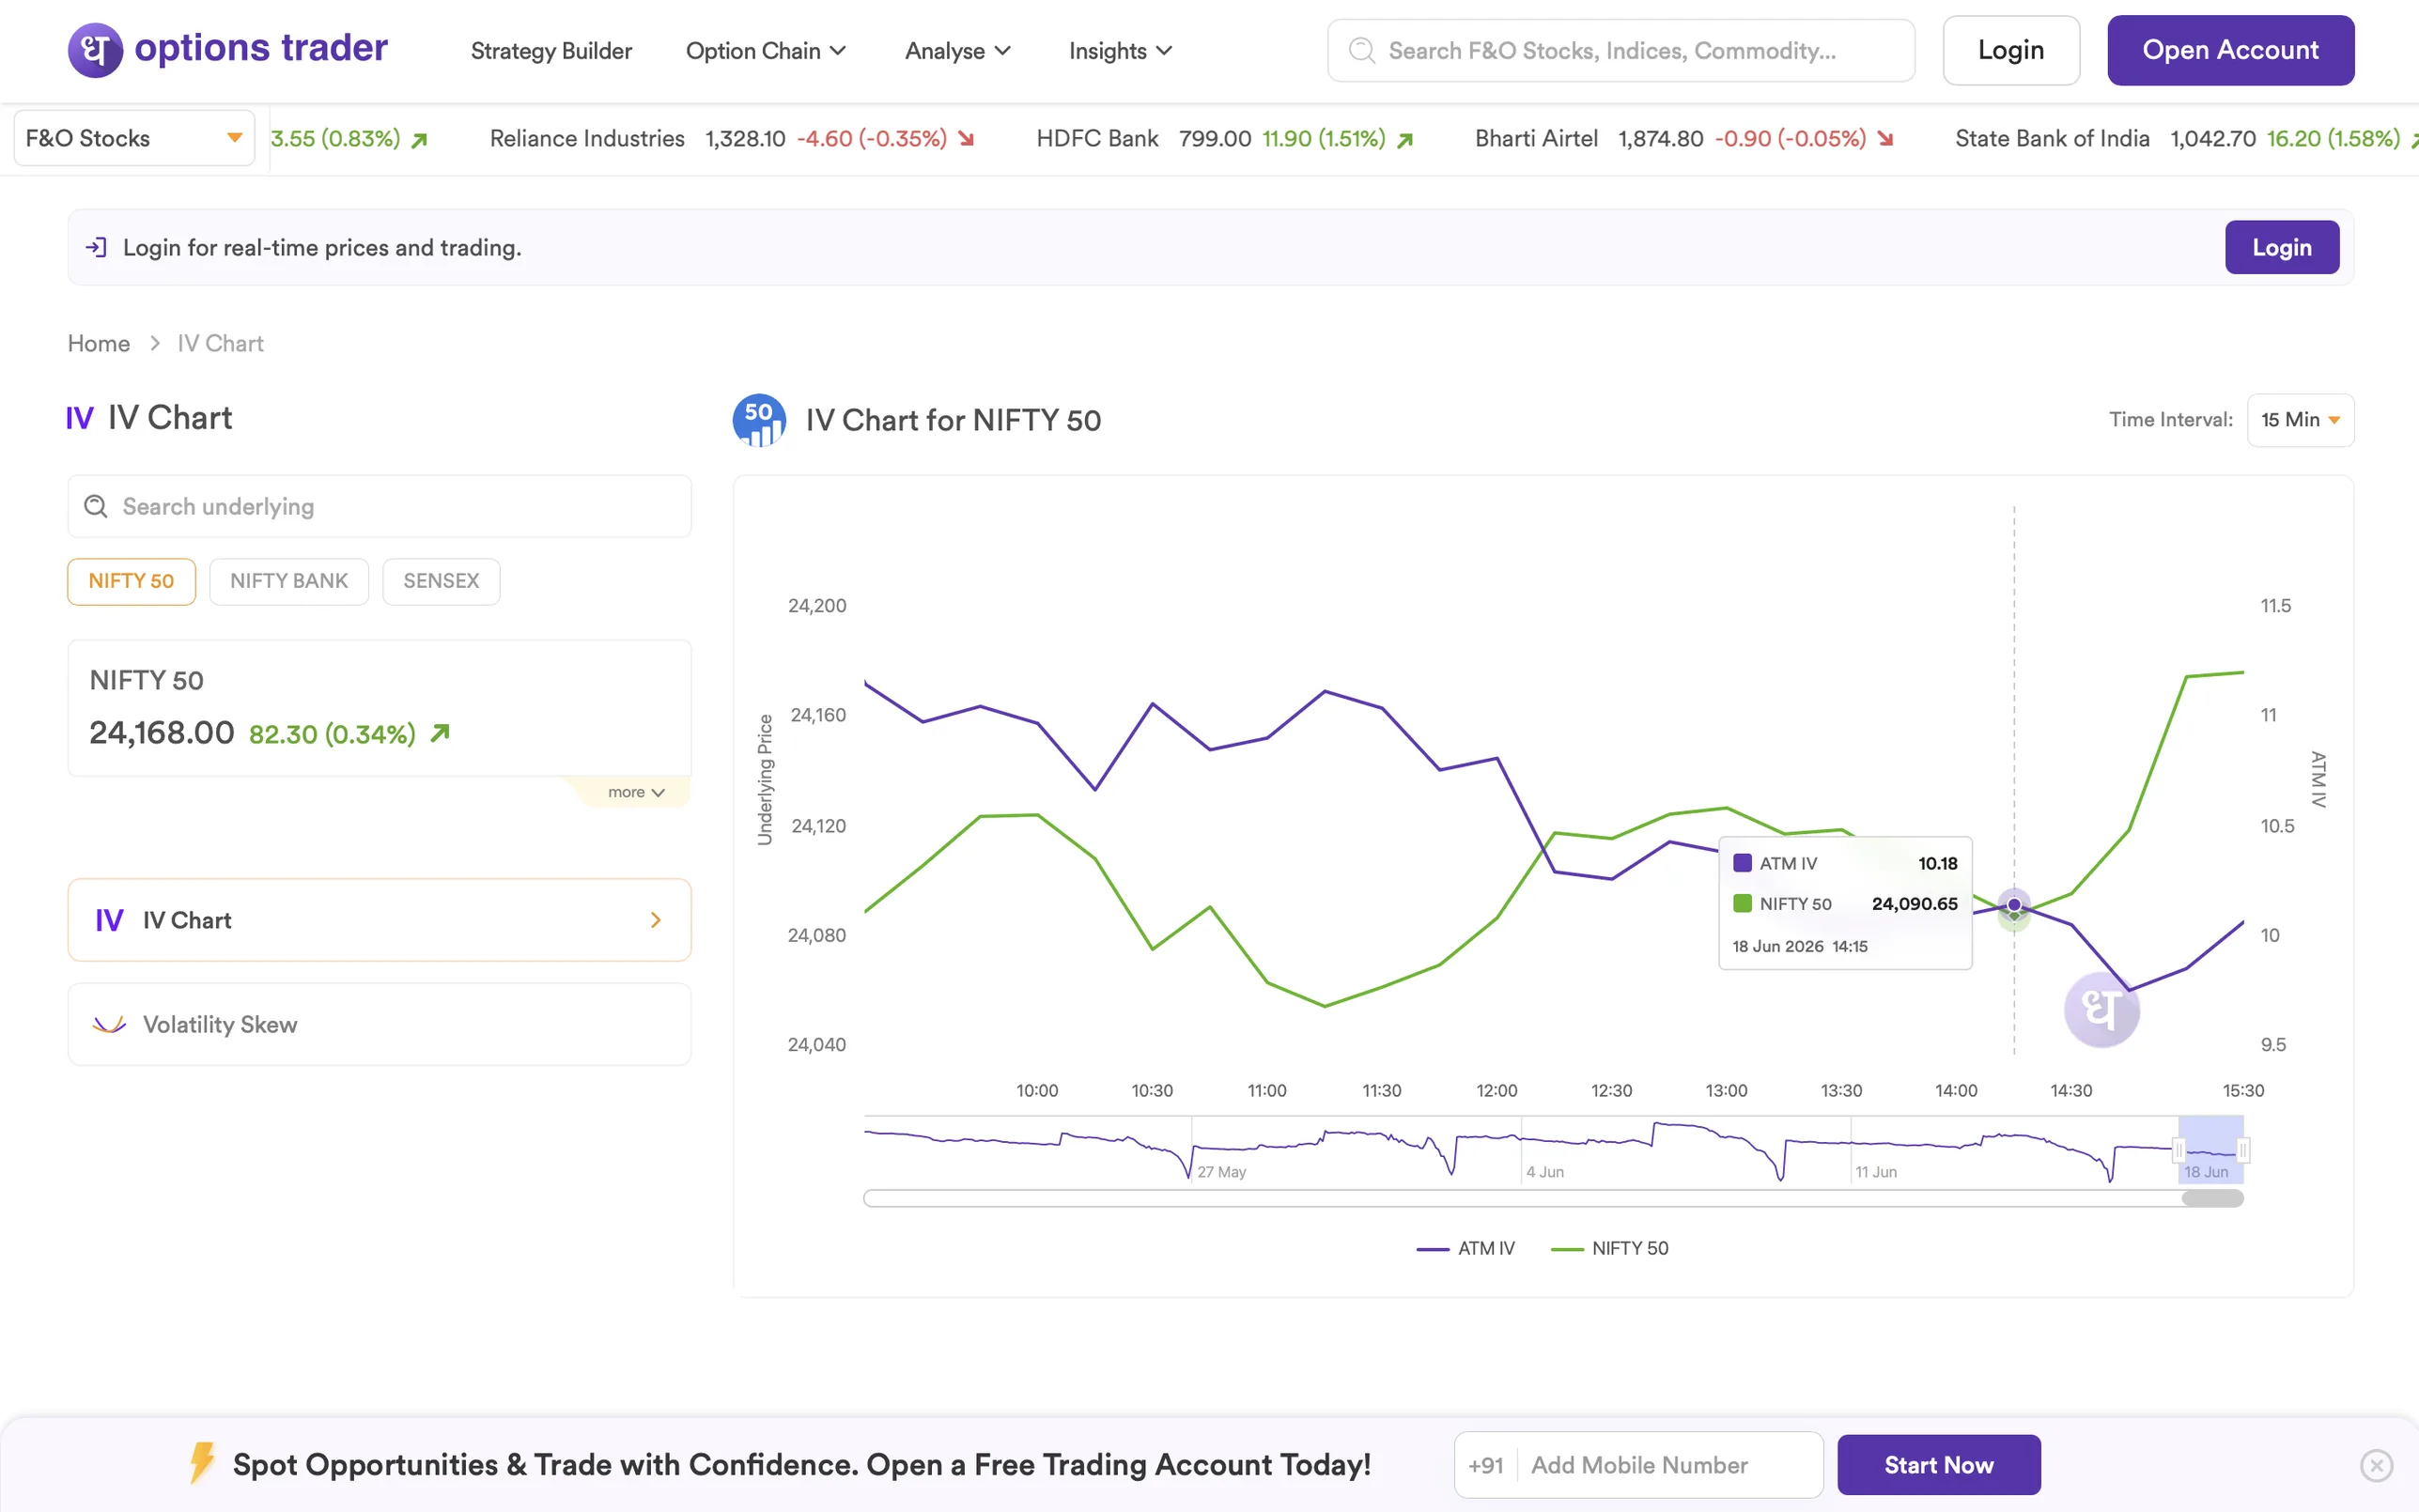
IV Chart - “Is the market repricing risk?”
ATM implied volatility plotted against the underlying price, both axes scaled to the strike range. When the lines diverge, sentiment is shifting - an early read the option chain hasn't surfaced yet.
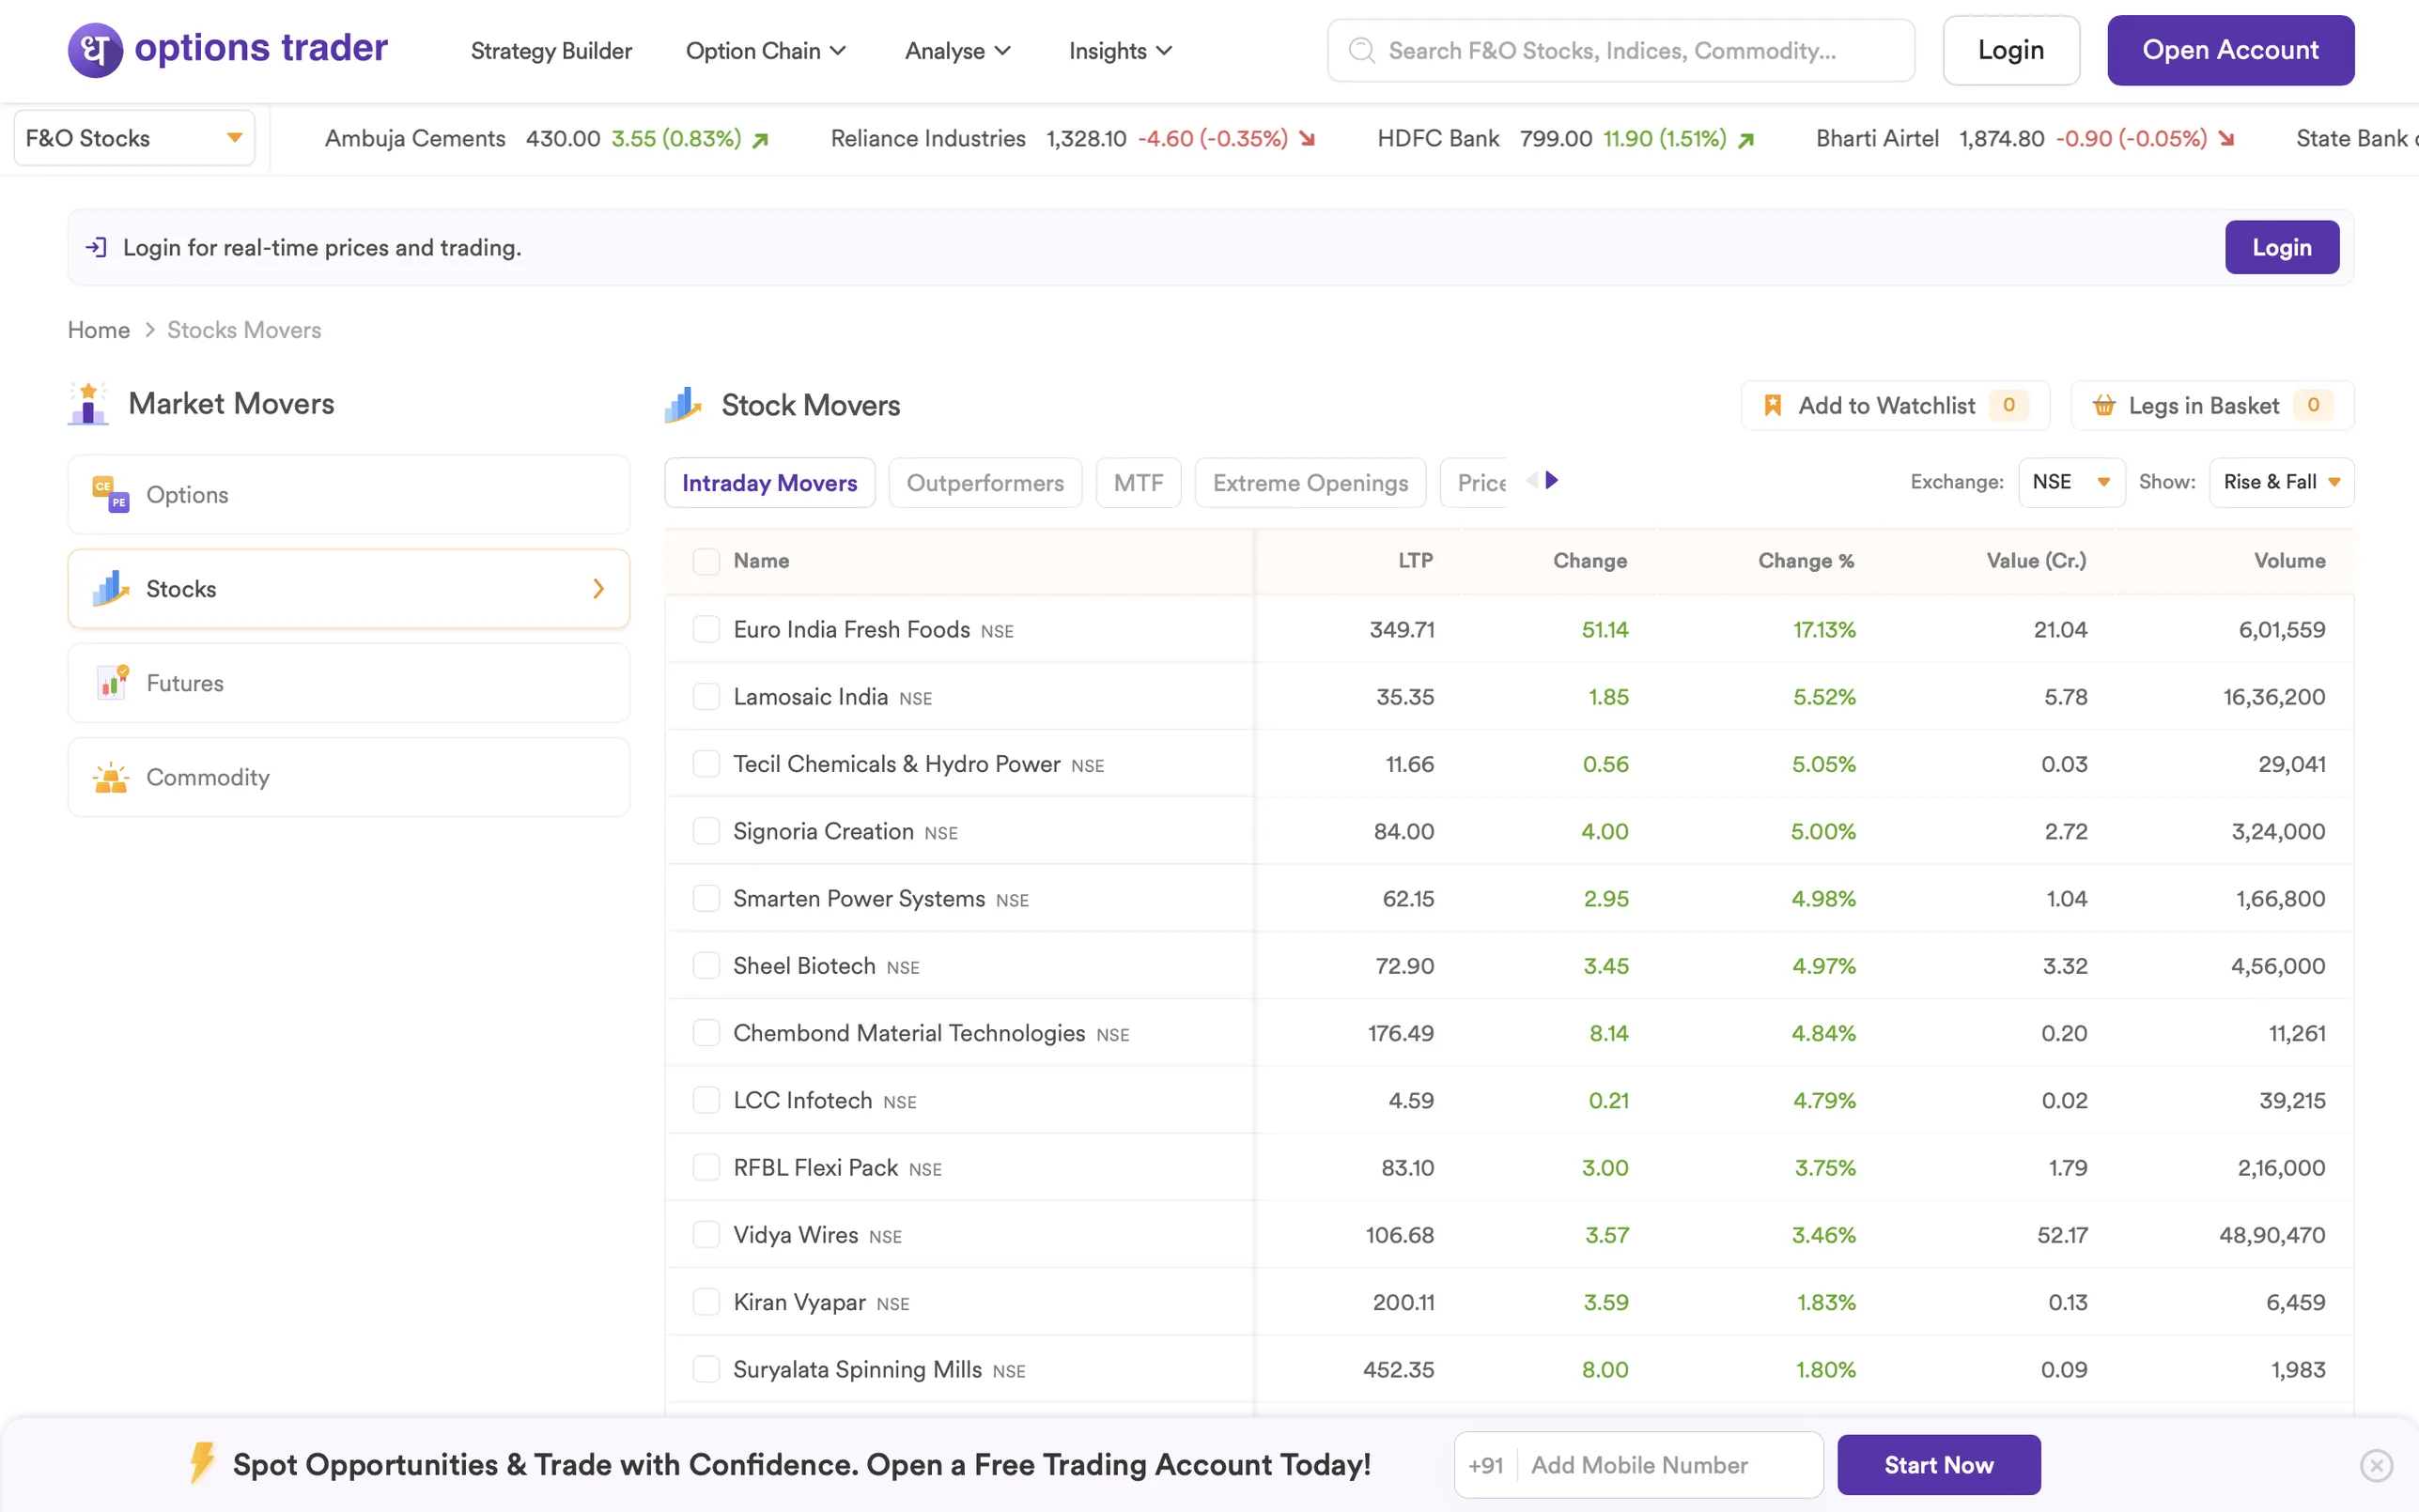
Market Movers - “Where is the flow today?”
Top gainers, losers, MTF, and Extreme Openings across Options, Stocks, Futures, and Commodity. The opening-bell scan - a quick lens into where the day's conviction is concentrated, before the trader picks a strike at all.
What shipped
Live at options-trader.co - indexed and serving real F&O traders today.
- 9 surfaces, one rollout. Landing page, Strategy Builder, Option Chain, and seven Analyse / Insights tools - all live together.
- Real product UI on the marketing surface. Visitors see the exact interface they'll use post-signup - no renders.
- The new F&O front door for Dhan. Replaces the old generic product page as the dedicated entry point for advanced traders.
What I Learned
- The audit reshaped the brief. Every competitor asked for sign-up before showing value - that gap became our design direction.
- For technical users, the landing page is the product. Trust comes from seeing real data, not marketing copy about it.
- Test on the hardware your users actually have. Mid-range Windows monitors - not studio MacBooks - drove the final visual direction.